

Master Corporate Training ROI with a Retention Ratio Calculator


When you hear "retention ratio," your mind might jump straight to finance departments or HR headcounts. But in corporate training and development, it's a completely different ballgame. We're talking about knowledge retention—a direct measure of how much information your employees actually remember and apply long after a training session ends.
Beyond Completion Rates: Understanding Training Retention

For too long, Learning and Development (L&D) departments have been stuck on one number: completion rates. It's the classic "checked-the-box" approach. It tells you who sat through the mandatory training, but it tells you absolutely nothing about its business impact.
Did the key lessons on new software or compliance procedures stick? Can your team apply what they learned next week, or even next month? This is where the training retention ratio completely changes the conversation. It forces a shift in focus from mere participation to tangible performance improvement.
Think about it. You roll out new company-wide software. Real success isn't defined by how many people clicked through the training module. It's about how many people can actually use that software efficiently 30 days later. That's the power of measuring what really matters for corporate development.
Why L&D Teams Need This Metric
Tracking knowledge retention gives you a direct line of sight into how effective your corporate training programs really are. It's the bridge that connects learning initiatives to real business outcomes. When you see a high training retention rate, it almost always leads to:
- Better Job Performance: Employees who actually remember their training are more competent and confident in their day-to-day roles.
- Fewer Costly Mistakes: When crucial information and procedures are retained, the risk of serious operational errors drops significantly.
- Higher Team Morale: Let's be honest, nobody likes corporate training that feels like a waste of time. Effective training that sticks empowers employees, boosting their job satisfaction and engagement.
This is a very different beast from the more common HR metric of employee retention. That's about keeping people in their seats. Employee retention is typically calculated as the number of employees remaining over a period divided by the number you started with, times 100. For example, if you start a quarter with 40 employees and end with 36, your employee retention is 90%. It's a vital metric, and you can dig deeper into that calculation over at HR Morning.
Our focus, however, is on the knowledge that stays with them after they leave the training session.
The table below breaks down this crucial shift in thinking for corporate training.
Shifting from Old Metrics to New Insights
Moving to retention-focused metrics isn't just about changing what you measure; it's about changing how you prove your L&D department's value.
By measuring what employees actually retain, L&D stops being a training administrator and becomes a strategic business partner. You can finally prove the real-world value and ROI of your efforts. It’s a fundamental change that platforms like Mindstamp champion by making corporate training not just engaging, but truly measurable with interactive video.
The Simple Formula for Calculating Knowledge Retention
You don't need a degree in data science to get a handle on knowledge retention. In fact, the core formula for your training programs is refreshingly simple, putting powerful insights right at your fingertips.
Forget the complex spreadsheets for a second. At its heart, it's just this:
[(Number of Employees Who Retained Knowledge) / (Total Number of Trained Employees)] x 100
That’s all there is to it. The result gives you a clear Training Retention Ratio as a percentage. The real work isn't in the math, but in deciding what "retained knowledge" means for your specific corporate training goals.
Defining Your Terms
To make this formula really work for your training program, you have to get specific about what "retaining knowledge" looks like in your organization. This isn't some universal standard; it's a benchmark you set based on the goals of the training.
- Total Trained Employees: This one's easy. It’s simply the total number of people who went through and completed the training module.
- Employees Who Retained Knowledge: This is where you define success. It’s the group that can prove they still have the knowledge after a certain amount of time has passed. Success might mean scoring 85% or higher on a follow-up quiz or flawlessly completing a simulated task in an interactive video.
Nailing down this success metric is everything. It’s what separates a vague hunch about your training's impact from having solid data to back up your L&D budget. For a deeper dive, you can explore a detailed breakdown of the entire retention ratio calculation in our complete guide.
This whole concept isn't new. SaaS companies live and breathe this stuff with their customer analytics. They obsess over customer retention rates to track growth and business health. You can see how businesses calculate these customer-focused rates on Idomoo.com. We're just applying that same rigorous, data-driven logic to our own team's development.
The most important thing here is consistency. Pick your measurement window—whether it’s 30, 60, or 90 days after the training—and stick to it across all corporate training programs. This is the only way you can reliably compare data over time and see the true long-term impact of your L&D initiatives.
How to Build Your Own Retention Ratio Calculator
You don't need fancy, expensive software to start measuring the impact of your corporate training. It's surprisingly straightforward to build your own simple—yet powerful—retention ratio calculator with tools you probably already have, like Google Sheets or Microsoft Excel. This DIY approach puts real training analytics right at your fingertips.
The setup is pretty simple. All you need is a spreadsheet with a few columns to track the essential data points over time. This basic structure is enough to start monitoring how well knowledge is sticking and pinpoint which of your training programs are truly hitting the mark.
Setting Up Your Calculator in Sheets or Excel
First things first, open a blank spreadsheet and create a few key columns to organize your information. This will be the foundation of your calculator, making it easy to pop in training data and see your results at a glance. For a more in-depth look at tracking this kind of data, check out our post on creating an employee training tracker.
Here’s a simple layout to get you started:
- Employee Name: To track individual progress.
- Training Module: The specific corporate training course they completed.
- Completion Date: The date the training was wrapped up.
- Follow-Up Assessment Date: When you tested for knowledge retention (say, 30 days later).
- Assessment Score (%): The result of that follow-up quiz.
This infographic breaks down the simple flow of calculating the ratio.
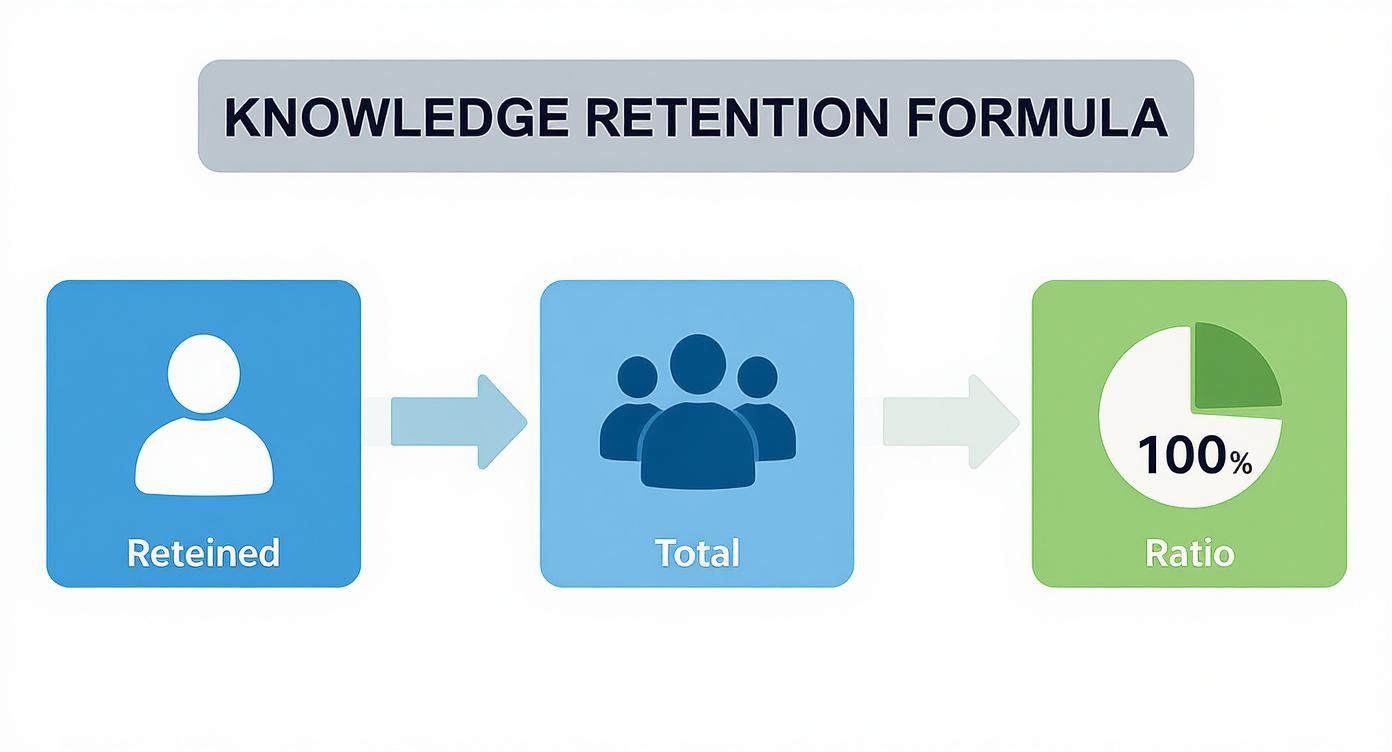
As you can see, it really just boils down to dividing the number of employees who remembered the information by the total number of employees you trained. Simple as that.
To make the magic happen automatically, you can add a formula. Let's say you decide that an assessment score of 80% or higher means the knowledge was successfully retained. You can use a COUNTIF function to do the heavy lifting for you.
This will give you an instant, at-a-glance look at your retention ratio without any manual counting.
A quick note: While a manual calculator is a fantastic starting point, this whole process can be automated. Interactive video platforms like Mindstamp have built-in analytics that track comprehension in real-time through interactive questions and quizzes embedded directly into the training video. This completely removes the need for manual data entry and gives you far deeper insights into training effectiveness without any of the setup headaches.
Actionable Strategies to Improve Training Retention
Figuring out your training retention rate is a great first step. But the real win? Actually improving it. Knowing the number is one thing; putting strategies in place to make sure knowledge genuinely sticks with your team is where you’ll see the payoff. This means shifting your corporate training from passive lectures to active, engaging learning experiences.
It helps to think about retention the same way the finance folks do. They use a retention ratio calculator to see how much of a company's net income gets reinvested back into the business for growth. For learning and development, we’re doing the same thing—reinvesting in our people to grow their skills and knowledge.
This financial metric, also called the plowback ratio, signals a company's commitment to long-term growth. We can apply that exact principle to employee development. You can dive deeper into the financial side of this concept over at Wall Street Prep.
Make Learning an Active Experience
Let’s be honest: the biggest enemy of knowledge retention is passive learning. When employees just sit back and watch a training video or click through a slide deck, their brains aren't fully engaged to process and store that information. The fix? Make them participate.
Interactive video is a game-changer for corporate training. Instead of a one-way lecture, you can embed elements right into the training content that force learners to engage. It completely transforms a passive viewing session into an active learning exercise.
Try sprinkling these interactive elements into your next training video:
- Embedded Questions: Pause the video and pop in a multiple-choice or open-ended question to check for understanding on the spot.
- Hotspots and Clickable Areas: Let your team explore a new product interface or a complex diagram by clicking on different parts to reveal more info. It turns them into active discoverers.
- In-Video Quizzes: End a key section with a quick quiz. This helps lock in the main takeaways before you move on to the next topic.
Personalize the Learning Journey
A one-size-fits-all corporate training program is a recipe for boredom and low retention. Employees come in with different backgrounds, skill levels, and learning speeds. This is where branching scenarios in interactive video come in. They let you build personalized learning paths that adapt to what an individual actually needs, making the content far more relevant and memorable.
Think about a sales training video on handling customer objections. Instead of a single, dry script, you could use a branching scenario in a tool like Mindstamp. Let the sales rep choose how they’d respond to a customer, and then show them the realistic outcome of that choice. This kind of active, decision-based learning is incredibly powerful for retention because they’re experiencing the concepts firsthand. It’s the difference between a lecture and a realistic, problem-solving simulation.
Connecting Higher Retention to Real Business ROI
Let’s be honest, a high training retention rate is more than just a feel-good L&D metric. For the C-suite, it's a direct signal of business health and efficiency. When knowledge from corporate training actually sticks with your team, it translates into tangible, bottom-line results that leadership really cares about.
Think about it: improved knowledge retention means fewer costly mistakes on the job. It also means a big boost in team productivity because employees can handle tasks correctly and confidently without needing constant refreshers or hand-holding. This is where your retention ratio calculator becomes an incredibly powerful tool for showing that direct link between training and performance.
Proving the Value of L&D
Here’s a real-world example I’ve seen play out. A customer support team used a new interactive training module and boosted its knowledge retention by 20%. The direct business impact? A 15% drop in their average ticket resolution times.
That single data point changes the entire conversation. Suddenly, you're not just reporting on training completions. You're presenting a clear, undeniable connection between your learning initiatives and core operational success. It’s how you start speaking the language of business outcomes and demonstrate your department's true value.
For more on this, check out our detailed guide on showing the ROI on training.
By consistently measuring knowledge retention, you shift the perception of your L&D department from a cost center to a strategic partner. You'll have the hard data you need to prove that investing in effective corporate training delivers measurable, organization-wide returns.
When you start digging into training effectiveness, a few common questions always pop up. Answering these early on will give you a much stronger foundation for actually measuring—and improving—how much your team remembers.
One of the first things people want to know is, "What's a good training retention rate?" It's a fair question. While every industry and topic is different, aiming for a 75-85% retention rate is a solid goal for corporate training programs. Honestly, though, the specific number isn't as important as seeing that number consistently climb over time. Progress is the real win here.
Measuring Retention the Right Way
Then comes the "how." How often should you actually check if people remember what they learned? Giving a quiz right after a session only tells you what's in their short-term memory. It doesn't prove they can apply it a month from now.
For the really critical stuff—the skills and processes that make or break performance—you need to space it out. Check in at 30, 60, and 90 days post-training. That’s how you’ll see what actually sticks for the long haul.
Trying to measure retention for soft skills can feel a bit fuzzy, but it's totally doable. You just have to get more creative than a standard quiz.
Ditch the multiple-choice questions for soft skills training. Instead, use scenario-based assessments, observation checklists for managers, or even 360-degree feedback. Interactive video is perfect for this—you can simulate a real-world customer complaint or a tough leadership moment and see how employees respond.
This gives you a much richer picture of your team's real-world capabilities than a simple retention ratio calculator ever could. It adds the "why" to your numbers.
Ready to see how interactive video can totally change your corporate training retention game? See how Mindstamp makes it simple to build learning experiences that are engaging, measurable, and drive real business results. Learn more about Mindstamp’s features.
Get Started Now
Mindstamp is easy to use, incredibly capable, and supported by an amazing team. Join us!


Try Mindstamp Free


