

Your Guide to Retention Ratio Calculation in Corporate Training


When you hear "retention ratio," your mind probably jumps straight to finance—dividends, net income, and shareholder reports. But for those of us in Learning and Development (L&D), that term has a completely different—and arguably more powerful—meaning. It’s all about measuring the stickiness of your corporate training programs and proving they're having a real, lasting impact on your workforce.
Why Your Training ROI Depends on Retention Metrics
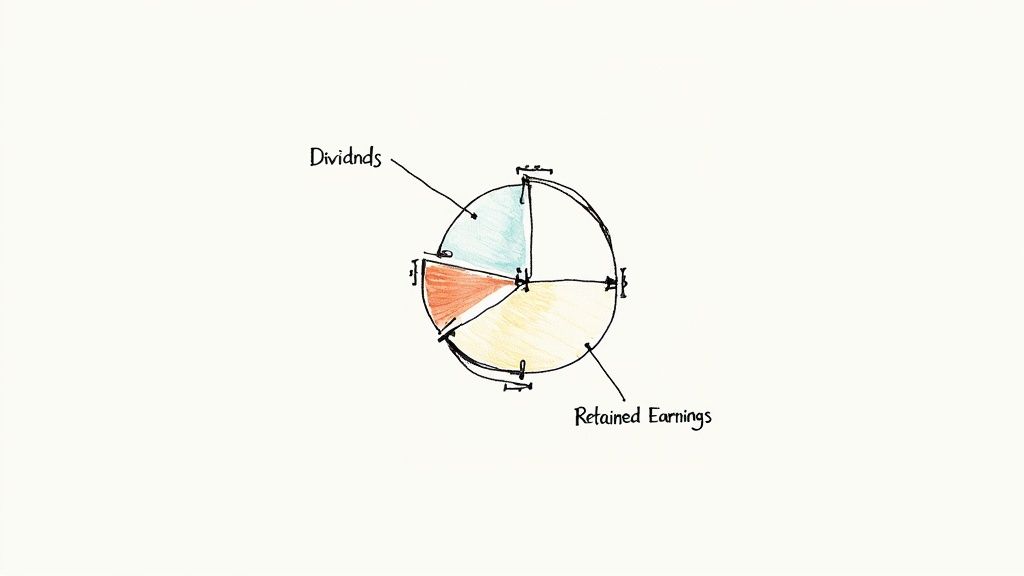
Let's clear things up right away. In the financial world, the retention ratio (or plowback ratio) shows how much profit a company plows back into the business instead of paying it out to shareholders. Investors keep a close eye on this to see if a company is focused on growth.
But in corporate training, we're shifting the focus from dollars to skills. Here, the "retention ratio calculation" measures something far more critical to an organization's health: learner retention. This is the metric that tells you what percentage of employees actually stick with a training program over a certain period, which is a powerful indicator of knowledge retention and engagement.
The Connection Between Learner Retention and Business Value
Tracking this kind of retention isn't just a box-ticking exercise. It's your direct line to proving the value of every L&D initiative you launch, from onboarding to leadership development.
A high learner retention rate is a fantastic indicator that your training content is hitting the mark. It means the material is relevant, engaging, and genuinely helping your employees grow. When employees willingly come back for more training, you know you’re providing real value that supports their career path.
This data is your most powerful tool for demonstrating impact. Instead of just reporting completion rates, you can show leadership how training programs contribute to building a more skilled, committed, and stable workforce, which is a core component of business success.
At the end of the day, engaged learners become retained employees. A solid training program that people stick with is a huge driver of employee satisfaction and can seriously cut down on costly turnover. This connection is fundamental when you're trying to calculate the true ROI on training investments.
- Justify Budgets: Strong learner retention numbers are the concrete evidence you need to defend and even expand your L&D budget.
- Improve Content: If you see low retention in a specific course, that’s your sign. It points you directly to content that needs a rethink or a more engaging format, like interactive video.
- Reduce Churn: Great training is a key driver of job satisfaction, which helps lower overall employee churn and all the costs that come with it.
How to Calculate Your Learner Retention Rate
Figuring out your learner retention rate isn't as complicated as it sounds—you definitely don't need a degree in data science. The formula is a simple adaptation of a classic business metric, customer retention. The only difference is we're tracking employees in a training program instead of customers.
The go-to formula for this is Retention Rate = ((E - N) / S) × 100. Let's break that down. 'E' is the number of learners you have at the end of the period, 'N' is the number of new learners who jumped in during that time, and 'S' is the number you started with. It’s a standard approach used by all sorts of member-based organizations to see who's sticking around, and it works perfectly for corporate training programs.
The concept is borrowed straight from finance, where retention ratios are key. This image shows the financial version of the calculation.
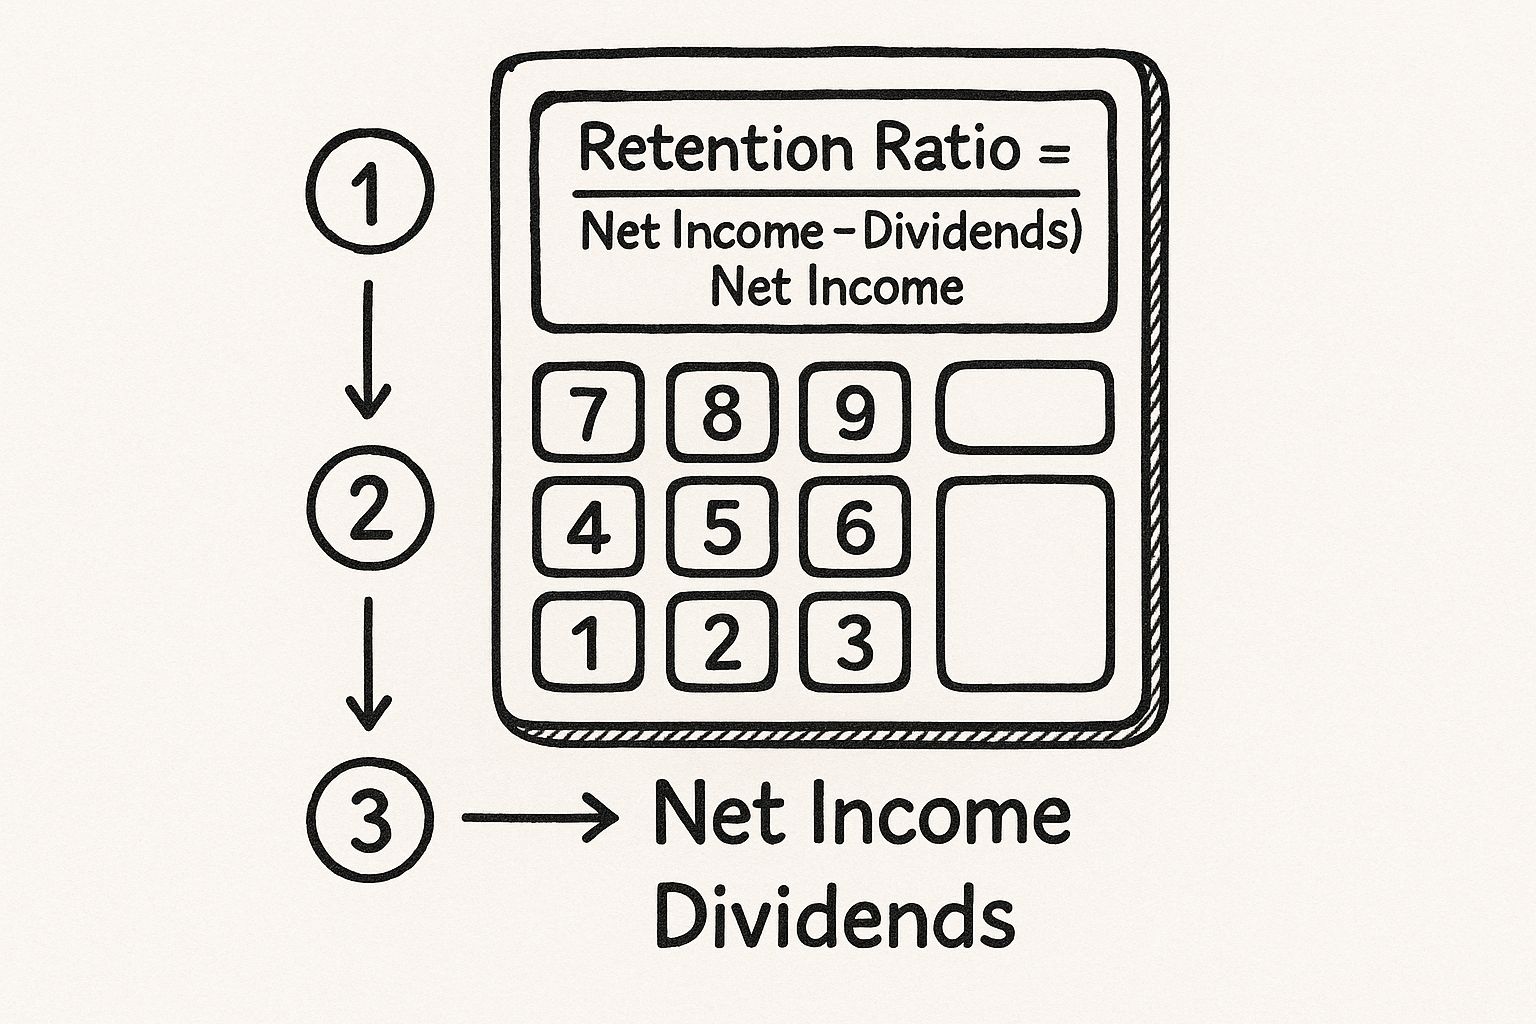
Even though the specific inputs are different (learners vs. dollars), the core idea is the same. You're measuring what you manage to keep versus what you started with.
Learner Retention Formula Variables
Here’s a quick reference table to make sense of each part of the formula in a corporate training context.
Think of these as the three essential ingredients you need to get an accurate picture of how "sticky" your training content is.
Putting the Formula into Practice
Let’s run through a real-world scenario. Say you rolled out a mandatory compliance course for the quarter.
- Start of Quarter (S): You kicked things off with 200 employees enrolled.
- New Hires (N): Over the next three months, 25 new hires were added to the training.
- End of Quarter (E): By the end of the quarter, 210 employees were still active in the course.
Now, we just plug those numbers into our formula:
((210 - 25) / 200) x 100 = 92.5%
That 92.5% tells you a story. It means you held onto nearly all your original learners, which is a fantastic indicator of the program's value. This simple calculation gives you a powerful baseline, but it's just one piece of the puzzle.
The goal is to move beyond simple completion rates. This calculation shows who is sticking with your program over time, which is a much stronger indicator of genuine engagement and content value.
This kind of ratio-based thinking is a valuable skill far beyond L&D. For instance, in finance, knowing how to calculate debt to income ratio is fundamental for lending. The underlying logic—using specific inputs to get a meaningful percentage—is a universal skill.
Going Beyond Completion Rates with Engagement Metrics

A basic learner retention calculation is a solid start, but it doesn't paint the full picture. Knowing who stays is one thing; understanding how deeply they’re engaging is where the truly valuable insights are hiding. If you're only tracking who finishes a course, you're missing the bigger story of how valuable your entire training ecosystem is to your people.
To get a richer narrative, we can borrow a page from the SaaS playbook and look at a metric called Net Dollar Retention Rate (NDRR). In the software world, this tracks revenue changes from existing customers—not just whether they renewed. An NDRR over 100% means your retained customers are actually spending more over time, which is a massive signal of value.
Adapting NDRR for Learner Engagement
So, how does this apply to Learning and Development? We can adapt this financial metric into what we can call a Net Engagement Value. Instead of tracking dollars, we'll track engagement "units"—things like the number of optional courses a learner takes, extra resources they download, or additional modules they complete.
This shifts the retention question from a simple "did they stay or leave?" to something much more insightful: "Are my retained learners engaging more or less over time?"
This simple twist helps you see if your training programs have real staying power. Are people in your leadership cohort just ticking the box on mandatory modules? Or are they actively seeking out the extra workshops and skill-building sessions you offer? This is how you move past just tracking attendance and prove real development is happening.
This shift in measurement tells a far more compelling story to leadership. It proves not only that people are completing their training, but that they are actively deepening their commitment to growth through the programs you've built.
Putting Net Engagement Value Into Practice
Let's walk through a quick example. Imagine you're tracking a cohort of 50 managers in an optional leadership development program.
- In Period 1, this cohort collectively completes 75 training modules (a mix of required and optional).
- In Period 2, the same group of managers, now more invested, completes 90 modules.
That 20% jump in engagement shows that the value of your training is actually expanding within your retained audience. It’s powerful proof that your L&D ecosystem isn't just a requirement—it's a resource your team finds increasingly valuable. Keeping an eye on these kinds of detailed video engagement metrics is how you build this kind of comprehensive picture.
Boost Your Retention Rate with Interactive Video
Knowing your numbers is the first step, but the real goal is to actually improve them. A strong retention ratio is a clear sign your training is working, and interactive video is one of the most direct ways to get there. It completely changes the game by transforming passive viewing into an active learning experience.
We’ve all sat through static training videos where our minds start to wander. Learners tune out, miss key concepts, and ultimately, the knowledge just doesn't stick. Interactive video flips that entire dynamic on its head by requiring participation. By embedding elements directly into the video, you create a two-way conversation that demands attention.
Turn Passive Viewers into Active Learners
The core idea here is to reinforce learning in the moment—not weeks later in some formal quiz. That immediate feedback loop is absolutely crucial for memory. Research has shown time and again that active participation massively boosts information recall compared to just passively watching or listening.
You can make this happen with features that have a direct impact on engagement and, by extension, knowledge retention:
- In-video Questions: After explaining a complex compliance rule, pop in a quick multiple-choice or open-ended question. This forces learners to pause, reflect, and confirm they actually understood what they just saw.
- Branching Scenarios: Imagine a sales training video where a rep has to choose how to respond to a customer objection. Their choices lead them down different paths in the video, letting them practice and see the outcomes of their decisions in a completely risk-free environment.
These aren't just bells and whistles; they're powerful tools for cognitive engagement. They break up the monotony of a standard, linear video and forge a more memorable and effective learning path for your employees.
Interactive elements like hotspots that reveal extra info or personalized paths based on a learner's role make the content feel relevant. This sense of personal investment is a huge driver for both course completion and long-term knowledge retention.
Of course, interactive video isn't the only tool in the shed. It's smart to explore other strategies for improving learner engagement, too. For instance, understanding the basic principles of how memory works can be a game-changer. There are plenty of practical tips for better memory retention out there that perfectly complement a strong training program.
When you combine engaging technology like interactive video with proven learning principles, you build a training ecosystem that doesn’t just teach—it sticks.
Find and Analyze Your Training Data in Mindstamp
Forget digging through complex spreadsheets. All the retention data you need is waiting for you right inside your Mindstamp analytics dashboard. Making a habit of checking this info is how you turn raw numbers into a smarter corporate training strategy.
Before you can even think about the retention ratio calculation, you have to know where your source data lives.
Inside Mindstamp, your analytics are a direct window into how your team is actually learning. You can finally move beyond simple completion rates and see the real story of how people engage with the material. This is where you start connecting specific moments in a training video to your bigger retention trends.
Interpreting Engagement Graphs and Heatmaps
First things first, head over to your video reports. This is where you’ll find viewer engagement graphs and heatmaps that give you a visual on your audience's collective attention span. A gentle, gradual slope is perfectly normal, but a sudden, sharp drop? That’s a huge red flag that a piece of your training isn't landing.
For instance, this engagement report gives you a clear, at-a-glance view of what’s happening.
See that spike in views followed by a nosedive? That might point to a tricky concept, or maybe it's just a spot where learners are checking out.
These data points are your early warnings. A significant drop-off in a compliance video is a clear signal that the content isn't holding attention, which will absolutely crush your retention numbers down the line. By analyzing these moments, you can pinpoint exactly where to add an interactive element or clarify a concept, making your training stickier and way more effective.
Common Questions About Calculating Training Retention
Once you start digging into the retention ratio for your corporate training programs, a few questions always seem to surface. Let's walk through a couple of the ones L&D pros ask all the time when they begin tracking these powerful numbers.
The big idea here is to shift your focus from one-off course completions to the long-term commitment of your learners. It's less about a final grade and more about taking a regular pulse on the health of your entire training ecosystem.
What Is a Good Learner Retention Rate?
Everyone wants a number to shoot for, and while every company is unique, a great benchmark for a learner retention rate in corporate training is 90% or higher. This figure is often the gold standard for healthy employee retention in general, and it tells you that your training programs are valuable enough to keep the vast majority of your team engaged and coming back.
But let's be realistic—context is everything. A mandatory annual compliance course is always going to have a higher retention rate than an optional, multi-part leadership series you’re trying to get off the ground.
The real key is to establish your own baseline and then focus on improving it over time. Seeing your retention rate climb, even if it starts low, is a clear sign that your L&D strategies are hitting the mark.
How Often Should I Calculate This?
To get insights you can actually act on, you should be calculating your learner retention ratio at least quarterly. This rhythm lets you spot trends as they’re happening and make smart adjustments to your content or how you deliver it.
Think about it: if you roll out a new onboarding module and notice a dip in Q2, you can jump on it right away instead of waiting until year-end reports. This kind of regular check-in makes sure you’re always steering your corporate training programs in the right direction.
Ready to see exactly how your team engages with your training videos? Mindstamp gives you the detailed analytics you need to stop guessing and start improving your learner retention. Get started today and turn your training content into a measurable success.
Get Started Now
Mindstamp is easy to use, incredibly capable, and supported by an amazing team. Join us!


Try Mindstamp Free


