
Boost ROI with Client Engagement Metrics for Corporate Training


In corporate training and development, the term client engagement metrics means something very different than it does in marketing. We’re not just counting eyeballs on a video. We’re measuring how deeply learners interact with, understand, and ultimately apply new skills. It’s about getting concrete data on learning effectiveness and proving the training program's business impact.
Why Training Engagement Metrics Are Not What You Think
When most people hear "engagement metrics," their minds jump to website clicks, social media likes, or email open rates. But for Learning and Development (L&D) professionals, those marketing-focused stats completely miss the point. In our world, client engagement is all about measuring comprehension and skill acquisition, not just fleeting attention.
Think of a traditional, non-interactive training video as a one-way lecture. Sure, you can see how many employees showed up (view count) and how long they stayed in their seats (watch time), but you have no clue if they were actually listening, taking notes, or absorbing the material. Did that critical safety protocol land? Did the new sales technique make any sense? With a standard video, you’re just flying blind.
This is where the definition of engagement has to shift for corporate training. True engagement isn't passive viewing; it's active participation.
Effective training engagement is the measure of a learner's cognitive and behavioral investment in the learning experience. It's the difference between simply hearing information and actually internalizing it.
Shifting from Views to Value
For L&D managers, the ultimate goal is to prove that training programs create real, tangible value and justify the investment. To do that, you need data that answers critical business questions, not just vanity metrics. This is where interactive video platforms like Mindstamp come in, transforming those passive video lectures into interactive, data-rich training modules. By embedding questions, polls, and branching scenarios directly into the learning content, you start capturing metrics that truly matter.
This modern approach helps you track:
- Active Participation: Are learners actually clicking on interactive elements and exploring the additional resources you’ve provided?
- Knowledge Comprehension: How accurately are they answering in-video questions and quizzes? This tells you what's sticking and what's not.
- Skill Application: Can they navigate a simulated scenario correctly, proving they grasp the material well enough to use it on the job?
By reframing client engagement metrics around these learning-specific interactions, L&D teams can finally move beyond surface-level stats. Instead, they can collect powerful data that demonstrates real learning, pinpoints knowledge gaps, and proves the undeniable business impact of effective corporate training.
The Three Tiers of Learner Engagement Metrics
To really get a grip on whether your corporate training is working, you have to look beyond a single, generic number. In the world of training and development, the most useful client engagement metrics aren't just one big blob; they're organized into distinct tiers. Each level you go up gives you a deeper, more meaningful insight into your program's effectiveness.
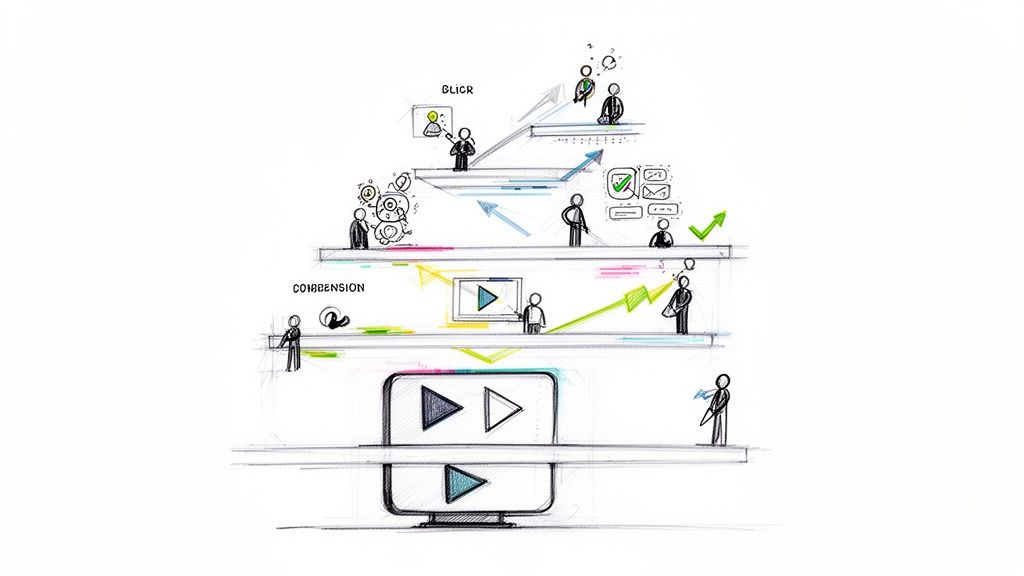
This hierarchy is a game-changer for L&D managers. It’s the roadmap for moving from just checking if content was delivered to actually measuring real, tangible business impact. The diagram below lays it all out, stacking the metrics from simple viewership at the bottom to the ultimate goal: training that truly influences on-the-job performance.
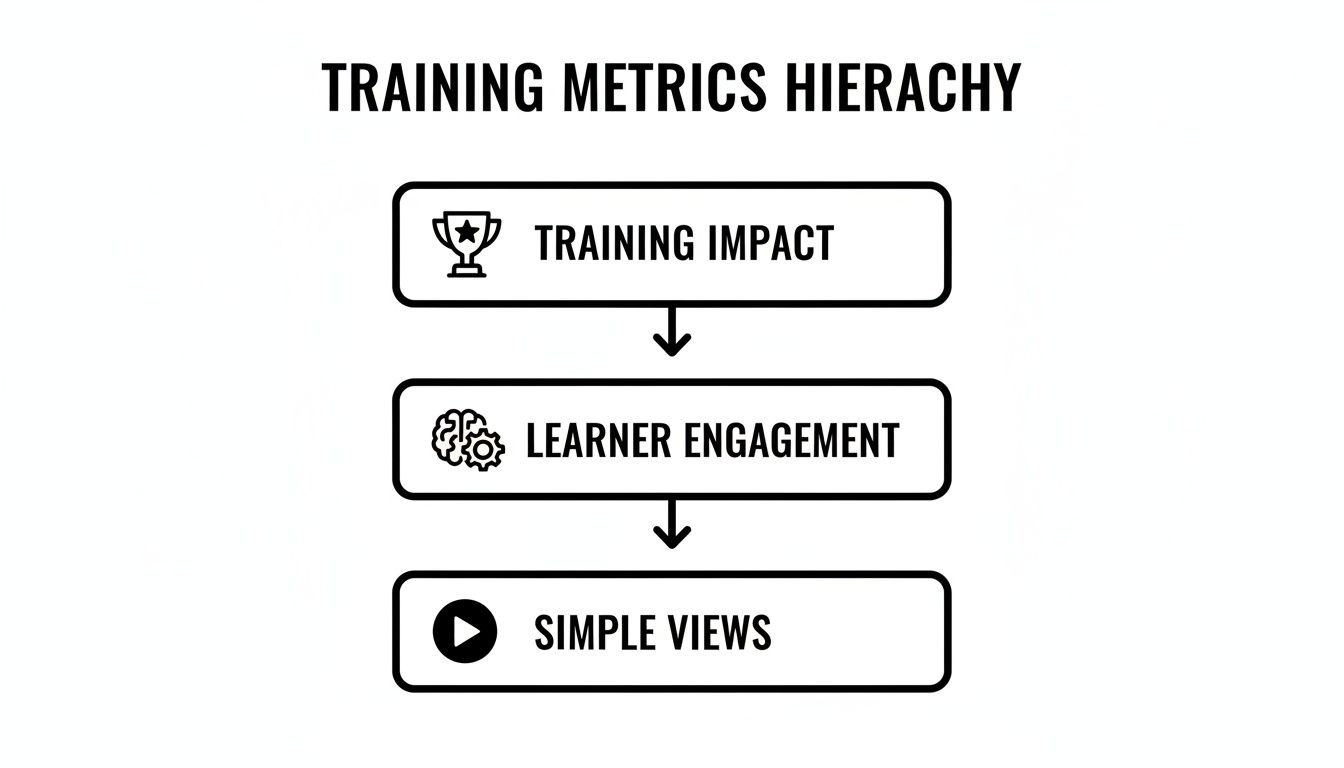
As you can see, simple views are just the foundation. The real gold is found when you measure genuine engagement and the actual impact it creates—all of which are built on that initial viewership.
To break it down, we've organized these metrics into a simple table that shows what each tier measures and what it looks like in the context of an interactive video platform like Mindstamp, designed for creating engaging learning and training content.
Three Tiers Of Corporate Training Engagement Metrics
This tiered approach helps you tell the full story of your training's value, from basic attention all the way to bottom-line results. Let's dig into each one.
Tier 1: Behavioral Metrics — What Learners Do
The first and most foundational tier is all about observable actions. Behavioral metrics answer a simple but crucial question: "Are employees actually interacting with the training content?" Think of it as the digital body language of your audience.
These numbers give you the most immediate feedback on whether your content is holding anyone's attention. Key examples include:
- Completion Rate: This is the percentage of learners who actually make it to the end of the module. A low rate is a big red flag that your content might be too long, too dull, or just plain confusing.
- Time Spent on Content: This tracks how long a learner is actively engaged with the video. It helps you see if people are just clicking through as fast as possible or if they’re taking the time to really absorb the material.
- Interaction Clicks: In an interactive video, this is pure gold. It tracks every click on a button, hotspot, or downloadable resource. It’s the difference between someone passively watching and actively participating.
Tier 2: Comprehension Metrics — What Learners Know
Moving up the ladder, we get to Comprehension Metrics. This is where we measure knowledge retention and actual understanding. It’s great if they watched it, but did they get it? This tier answers the critical question: “Did the key messages and skills actually stick?”
This is where interactive platforms like Mindstamp really shine. They turn a one-way lecture into a two-way conversation by embedding questions right into the video, giving you real-time data on who understands what.
Essential comprehension metrics to track are:
- Quiz and Poll Scores: Average scores on in-video questions are a dead giveaway for how well concepts are landing. If you see scores dip in a specific chapter of the video, you know exactly which part of your content needs a rewrite.
- Question Response Analysis: Don't just rely on multiple-choice. Analyzing the answers to open-ended questions can uncover common misconceptions or points of confusion that a simple quiz might miss entirely.
Tier 3: Impact Metrics — How Training Affects Performance
Finally, we arrive at the top of the pyramid. This is where you connect your training program directly to business outcomes. Impact Metrics answer the ultimate question that every stakeholder wants to know: “Is this training actually improving job performance and driving the business forward?”
These are, without a doubt, the most powerful metrics for demonstrating ROI. They might include things like skill application on the job, a noticeable reduction in compliance errors, or a clear improvement in sales performance after a new product training.
Sure, these can be trickier to track, but they provide the definitive proof that your training program isn't just a cost center—it's a value driver.
To explore a broader range of engagement metrics that apply across different business functions, check out our guide on user engagement metrics.
How to Track Engagement in Your Training Programs
Gathering data on learner behavior is one thing, but turning it into something you can actually use is a whole different ballgame. A solid measurement strategy is what separates raw numbers from a clear picture of how effective your training really is. This means you need to move beyond just collecting data and start actively tracking key client engagement metrics with a purpose.
The good news? You don't need a degree in statistics to get started. Many of the most important metrics can be figured out with simple formulas. Take the Completion Rate, for example—it's one of the most vital signs of your content's health and it's a piece of cake to calculate.
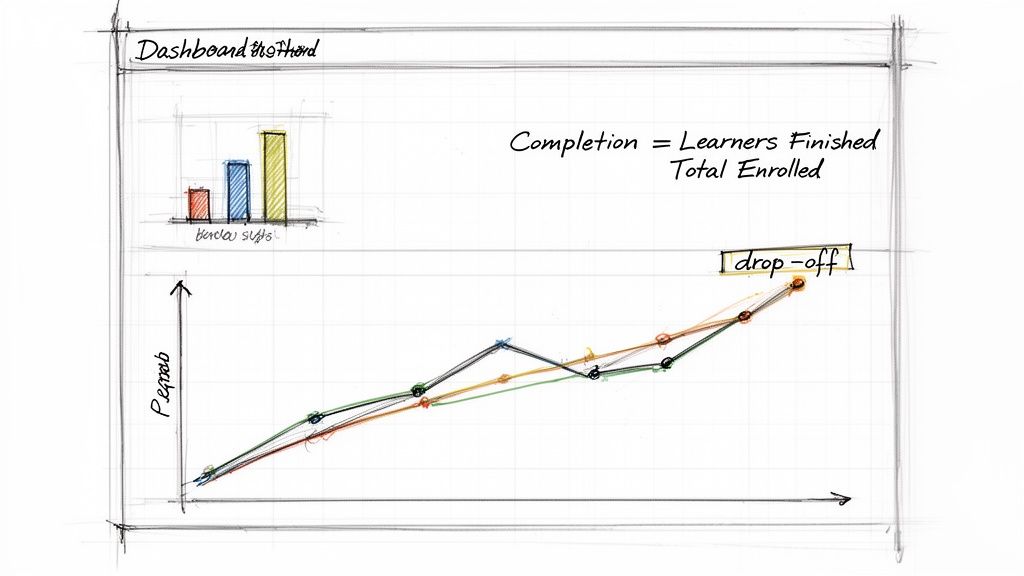
Completion Rate Formula:
(Number of Learners Who Finished the Module / Total Number of Learners Enrolled) x 100
This one percentage tells you instantly if your content is grabbing attention or if people are dropping off halfway through. You can use similar math for quiz pass rates or interaction clicks, but let's be honest, this manual approach runs out of steam pretty fast. Trying to keep up with these metrics for hundreds of learners turns into a logistical nightmare of endless spreadsheets and mind-numbing data entry.
Automating Your Measurement with an Analytics Dashboard
This is exactly where a dedicated interactive video platform becomes a game-changer. Tools like Mindstamp take the entire tracking process off your plate, completely eliminating the need for manual math and clunky spreadsheets. Instead of burning hours crunching numbers, you get immediate access to a visual, intuitive analytics dashboard for your training content.
Think of this dashboard as your mission control for learner engagement. It pulls all those key metrics we've been talking about into one clean, accessible spot, letting you see exactly how your training content is performing at a single glance.
From Raw Data to Real-Time Decisions
An analytics dashboard does so much more than just spit out numbers; it shows you trends and pinpoints specific problem areas. It lets you shift from putting out fires after the fact to proactively making your training content better.
Here’s how a dashboard helps you make smarter, data-driven decisions on the fly:
- Identify Drop-Off Points: See the exact moment in a video where viewers bail. That’s a massive red flag telling you the content right there might be confusing, boring, or just plain irrelevant.
- Analyze Question Performance: Instantly see which quiz questions are tripping everyone up. This helps you spot complex topics that might need a clearer explanation or a few more real-world examples.
- Segment Learner Groups: Filter your results to see how different departments are doing. You might find that the sales team crushes the product demos, but the support team is struggling with the technical troubleshooting modules.
By automating how you track your client engagement metrics, you free yourself up to focus on what actually matters—figuring out what the data means and using it to refine your training strategy. This real-time feedback loop gives you the power to make targeted improvements that directly boost learner comprehension and, ultimately, drive better results for the business.
Using Interactive Features to Boost Engagement
Once you have a system for tracking client engagement metrics, the real work begins. It’s time to move from passively collecting data to actively improving those numbers. The secret isn't just to present information—it’s to pull your audience into the learning process through interactivity.
Simply put, interactive elements turn passive viewing into an active learning experience. Every click, response, and choice becomes a valuable data point, but more importantly, it’s a moment that reinforces knowledge. This creates a powerful feedback loop that keeps learners invested and makes the material stick. Mindstamp is an interactive video platform that allows you to create this exact kind of engaging, interactive learning and training content.
Turning Knowledge Checks into Retention Tools
In-video questions are so much more than a test. They’re powerful tools for boosting memory and retention. When a learner has to pause and recall information they just saw, it strengthens the neural pathways for that concept.
This simple act of recall transforms a lean-back viewing session into a hands-on exercise. You can explore various student-centered learning activities to see how this works in practice. For instance, instead of saving everything for a big quiz at the end, try embedding short questions right after you introduce a key idea. This gives learners immediate reinforcement and builds their confidence as they go. Our guide on how to add interactive questions to any video shows you exactly how to get started.
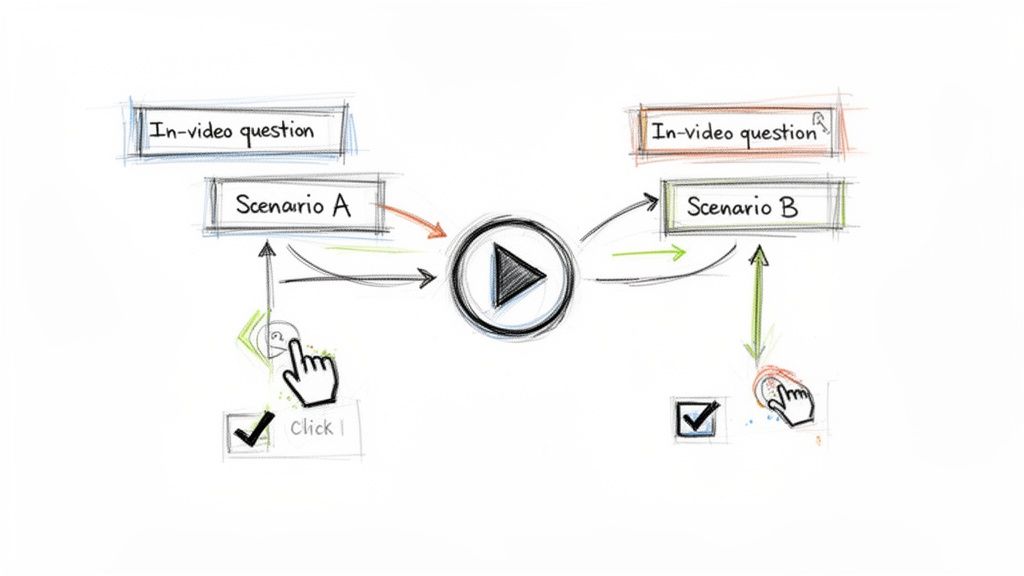
Creating Personalized Paths with Branching Scenarios
Let's face it: not everyone learns the same way or at the same speed. This is where branching scenarios are a game-changer. They let you build personalized learning journeys based on an employee’s choices. For example, a quick question can send a more advanced user straight to the next topic while redirecting someone who's struggling to a quick review video.
Interactivity isn’t a gimmick; it’s a strategic tool for creating the positive feedback loops needed for effective learning and development. By making training a two-way street, you dramatically increase the chances that the knowledge will stick.
This kind of personalization has a massive impact on completion rates. When content feels relevant and tailored, people are far more likely to see it through. The data backs this up. Mobile app benchmarks show that engaging users early can boost 90-day retention to 83%—more than double the industry average. When you make the experience about them, they’re much more likely to stay committed.
Connecting Training Metrics to Business Goals
Look, tracking learner data is only half the battle. To really show how valuable your corporate training programs are, you have to connect those client engagement metrics to the big-picture business goals that leadership actually cares about. It's all about translating training data into the language of business impact—things like revenue, efficiency, and growth.
When you can draw a straight line from your training initiatives to tangible results, L&D stops looking like a cost center. Instead, it becomes a powerful driver of the company's success. The trick is to build a compelling, data-backed story that proves your program’s worth.
From Learner Data to Business Impact
This whole process kicks off when you pinpoint the right business key performance indicators (KPIs) to link up with your training data. Just think about the specific problems your training was built to solve. Was the goal to boost sales performance? Cut down on compliance risks? Or maybe get support teams up to speed on new products?
Once you have a business KPI in your sights, you can start to connect the dots. For instance:
- Sales Training: You could show how sales reps who scored 90% or higher on a product knowledge quiz also managed to achieve a 15% shorter sales cycle.
- Compliance Training: Correlate high completion rates with a measurable drop in workplace safety incidents or costly compliance slip-ups.
- Onboarding Programs: Demonstrate that new hires who dove into interactive scenarios got up to full productivity 20% faster than their peers.
This approach turns fuzzy metrics like "engagement" into solid outcomes like "faster revenue" and "lower operational risk." To get a better handle on how to gather, interpret, and use data for these kinds of strategic decisions, check out this guide on marketing analytics.
Justifying Your L&D Budget with Data
The power of this approach goes way beyond just proving your value; it's absolutely critical for justifying your budget and getting the green light for future projects. Using advanced engagement tools to drive business outcomes is already a proven strategy in other departments.
A 2023 IDC study found that organizations adopting advanced engagement tools saw a 12% rise in conversion rates and were able to launch 27% more campaigns.
This same logic applies directly to corporate training. When you can show that better comprehension metrics lead to better job performance, you build an undeniable case for investing in better training tools and methods. We cover this in-depth in our complete guide on training effectiveness measurement. By linking every dollar spent on L&D to a clear business return, you position your department as a non-negotiable part of the company's success story.
Continuously Optimizing Your Training Strategy
Great training programs are never really "finished"—they evolve. Think about how a modern marketing department is constantly tweaking campaigns based on live data. Your Learning and Development (L&D) team can do the exact same thing, using client engagement metrics to continuously sharpen your training strategy. This feedback loop is what turns good content into great content, because you’re responding directly to how learners actually behave.
The trick is to stop seeing your training videos as static assets. They’re dynamic tools that you can test and improve over time. When you bring a data-driven mindset to L&D, you can finally move beyond guesswork and make precise, impactful changes that actually boost knowledge retention and on-the-job performance.
Using Data to Pinpoint Improvement Areas
So, where do you start? The first step is figuring out exactly what needs to be fixed. Vague feedback like "the training was confusing" doesn't give you much to work with. But with detailed analytics from an interactive video platform like Mindstamp, you get a clear roadmap for improvement.
- Video Heatmaps: These are fantastic. Heatmaps give you a visual breakdown of which parts of a video are being rewatched the most. A sudden spike in rewatches is a huge clue that a specific concept is either complex or not explained clearly enough. That’s your cue to jump in and add a clarifying pop-up or a link to a helpful resource.
- Drop-Off Points: Analytics can show you the exact second learners start to lose interest and click away. Once you pinpoint these moments, you can trim out the fluff or add an interactive element—like a quick poll or a question—to pull their attention right back.
By looking at granular interaction data, L&D teams can diagnose weak spots in their content with the same precision as a marketing team analyzing a conversion funnel. It transforms training from a one-off event into an ongoing cycle of improvement.
A/B Testing for Maximum Impact
Okay, you've found a potential weak spot. Now what? How do you know if your proposed fix will actually work better?
The answer is A/B testing. It’s a simple concept: create two versions of a video element and see which one performs better with your audience. For instance, you could test a text-based question against an image-based one. Or maybe you try out different calls-to-action to see which one gets more clicks on a resource link.
This approach mirrors the sophisticated strategies already used by top brands. In the EMEA region, a whopping 48% of leading companies are using real-time signals like clicks and views to personalize user journeys and optimize their content. This allows them to track a much broader set of KPIs and constantly refine their strategies for better results. You can learn more about how top brands are leveraging real-time data on braze.com.
By applying these same principles to your training, you can start making informed decisions that systematically make your L&D programs more effective.
Frequently Asked Questions
Diving into client engagement metrics can feel a bit overwhelming, especially if you're a Learning and Development (L&D) pro trying to make sense of it all. But don't worry, a few core ideas can get you a long way. Let's tackle some of the most common questions we hear.
What Are the First Metrics to Track for a New Program?
When you’re rolling out a brand-new training program, it's easy to get lost in the data. My advice? Keep it simple at the start. Focus on a few foundational metrics to get a quick, honest read on how things are going.
You need a solid baseline, and these three will give you just that:
- Completion Rate: Are people actually finishing the course? It’s the most basic, yet most telling, sign of initial engagement.
- Average Quiz Score: This is your gut check for comprehension. It tells you, point-blank, if your key takeaways are landing with the team.
- Time Watched: Is your content holding their attention, or are they tuning out after the first few minutes? This metric reveals a lot about how compelling your material is.
Tracking these from day one will instantly show you what’s working and flag any problem spots that need a quick fix.
How Can I Use Engagement Metrics to Prove Training ROI?
This is the big one. To prove the ROI of your training, you have to connect the dots between your program and real business results. It’s not enough to say people liked the training; you have to show it moved the needle.
Before you even launch, pick a relevant business KPI to measure. This could be anything from the number of support tickets to the average length of a sales cycle. Get your baseline number.
Once the training is done, track that same KPI. If you can show that highly engaged learners directly impacted that number, you've got a winning argument. For example, being able to say, "Team members who scored over 90% on the compliance training had 15% fewer errors" is a powerful, data-driven story that leadership can't ignore.
How Often Should I Review My Training Metrics?
There’s no single right answer here—it really depends on the training itself. If you're running a time-sensitive program, like for a major product launch or a critical compliance update, you should be looking at the data weekly. This lets you jump in and help anyone who's falling behind right away.
For your more evergreen, ongoing training content, a monthly or even quarterly check-in is usually enough. This cadence helps you spot the bigger trends over time and see where you can tweak the content for better results down the road.
Ready to stop guessing and start knowing what works in your corporate training? Mindstamp makes it incredibly simple to add questions, quizzes, and other interactive features to your videos. Then, you can see every single interaction on a real-time analytics dashboard. Start your free trial today and see the data for yourself.
Get Started Now
Mindstamp is easy to use, incredibly capable, and supported by an amazing team. Join us!


Try Mindstamp Free


