
Using User Engagement Metrics to Boost Training Success


When we talk about user engagement metrics, what we’re really asking is: “Is anyone actually paying attention?” In corporate training and development, these are the data points that show us how employees are really interacting with learning content, moving way beyond a simple view count to measure active participation and knowledge retention.
For Learning and Development (L&D) professionals, this means we can finally see if the training is sticking. By tracking clicks, answers to in-video questions, and completion rates within platforms like Mindstamp, we get a true sense of learning effectiveness and can prove the value of our training initiatives.
Why Views Alone Are Not Enough

Let’s be honest: in the world of corporate learning, judging a training video’s success by its view count is an old-school move that just doesn't cut it anymore. A "view" only tells you an employee hit the play button. It says nothing about whether they understood the new compliance policy, paid attention during the software tutorial, or retained a single piece of critical information.
It’s the classic difference between mandatory attendance and genuine learning.
Think of a standard, non-interactive training video like a massive, impersonal lecture. You can count the number of employees in the room, sure. But you have no idea who's actually absorbing the material, who's completely lost, and who's just daydreaming about their next project. Your main metric—attendance—is shallow and gives you zero clues on how to make the next training session better.
The Shift to Interactive Measurement
This is where interactive video, powered by a platform like Mindstamp, completely changes the game for corporate training. It transforms that passive lecture into a dynamic, one-on-one coaching session. Instead of just pushing information at your team, you’re starting a conversation and measuring comprehension in real time.
And in a productive conversation, you need feedback. That’s what user engagement metrics provide. They’re the missing feedback loop that tells you what’s really happening on the other side of the screen.
By focusing on engagement, you shift your training from being a simple cost center to a strategic asset that demonstrably improves employee skills and performance. This data-driven approach allows you to prove the value and ROI of your L&D initiatives.
This isn’t just a small tweak; it’s a fundamental change in how we think about the effectiveness of training content. The same principles apply across different media—for a deeper dive, check out this guide on how to measure podcast performance and track real business impact. It’s never about the raw download or view count, but the quality of the interaction.
Ultimately, tracking these deeper metrics allows L&D teams to finally see:
- Where employees struggle with tricky concepts or complex procedures.
- Which parts of the training are resonating the most and driving knowledge retention.
- How to refine your content for better learning outcomes and improved on-the-job performance.
In this guide, we’ll break down the specific metrics that truly matter for corporate development and show you how to use Mindstamp to turn that raw data into powerful insights for your training programs.
The Four Core Metrics of Learner Engagement
If you want to know if your corporate training is actually working, you have to look beyond surface-level data. Focusing on the right user engagement metrics is what turns your interactive videos from just another piece of content into a powerful diagnostic tool for employee development. These four core pillars give you a clear window into how your team is really interacting with the material.
This simple diagram shows how you can drill down from high-level traffic into much more meaningful engagement data.
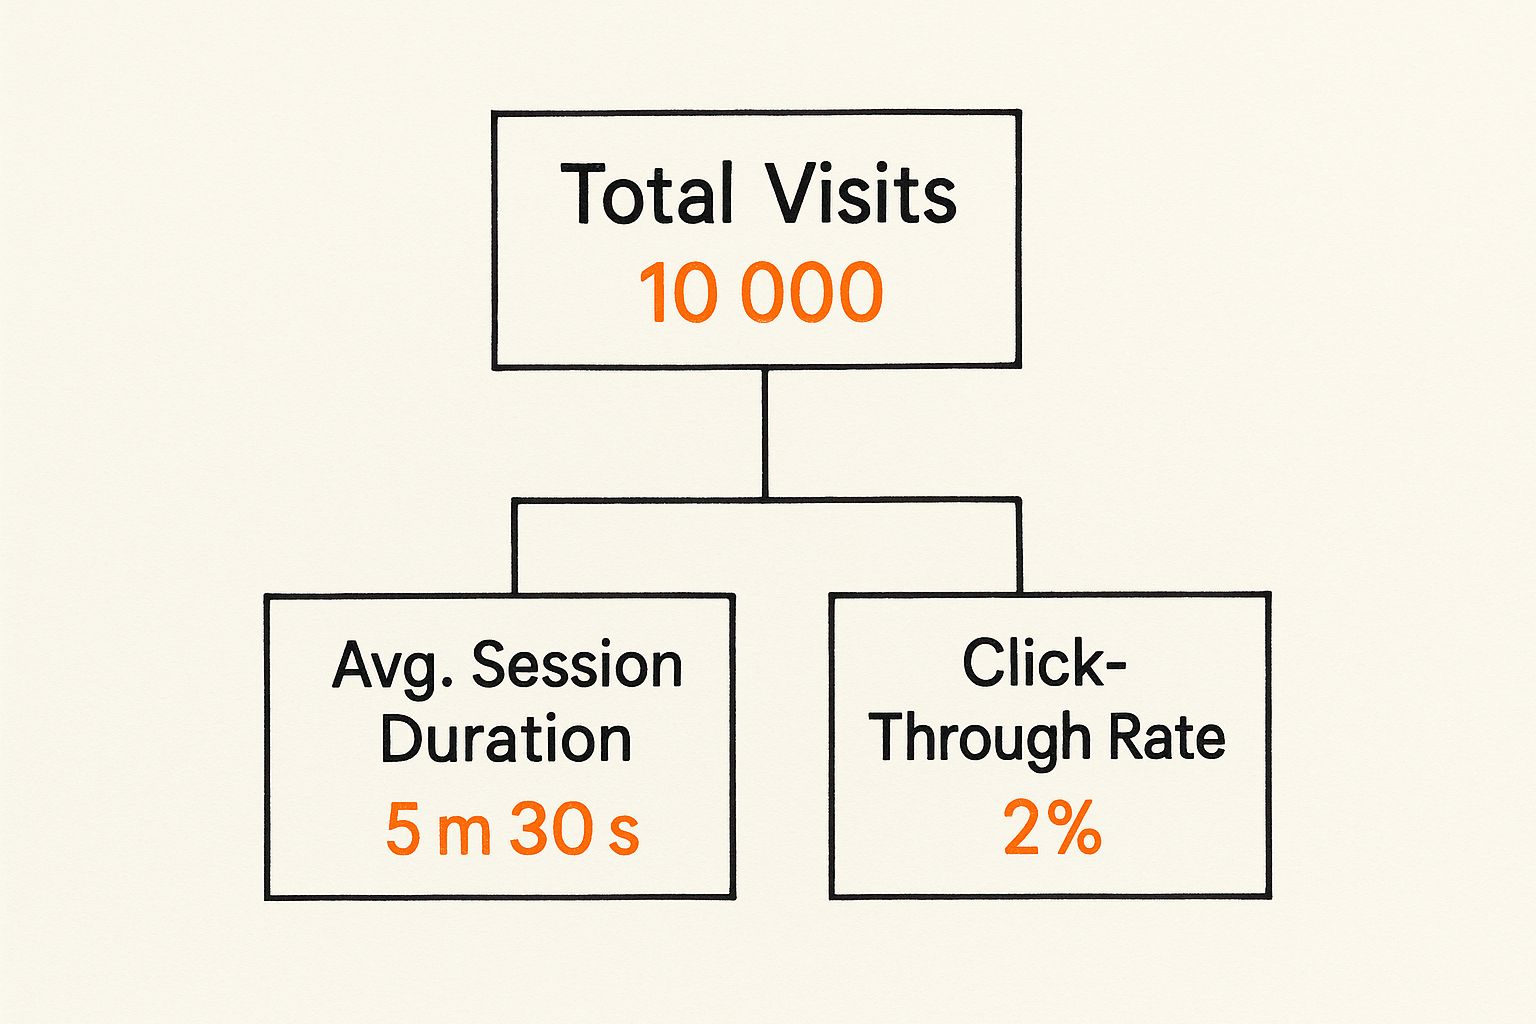
Starting with just 10,000 total visits, you can already see an average session duration of over five minutes. That’s a strong sign that people are sticking around.
Completion Rate: The Full Journey
Did they finish what they started? That’s what completion rate tells you—the percentage of learners who watch a video all the way through. In a training context, this isn't just about watching a video; it’s about completing a learning journey.
A high completion rate is a great sign. It suggests your content is well-paced, relevant, and holds your team's attention from start to finish. A low rate, on the other hand, is a major red flag. It’s telling you that something is causing employees to check out before they get all the critical info, whether it's the length, complexity, or just the delivery.
Interaction Rate: From Passive to Active
This metric tracks how often learners actually do something with the interactive elements you’ve built into your Mindstamp videos. Did they answer a quiz question? Click a hotspot to learn more about a new process? This is the clearest sign you have that they've shifted from passive viewing to active learning.
A high interaction rate means your employees aren't just watching; they're participating. They are actively thinking, questioning, and connecting with the material, which is absolutely essential for genuine knowledge retention and skill development.
Viewer Questions and Comments: A Direct Feedback Channel
Viewer questions and comments are like a direct line into your learners' minds. When an employee submits a question right inside the video, they’re pinpointing the exact moment they got confused or wanted to dig deeper into a topic.
This is qualitative gold for any L&D professional. Monitoring these submissions shows you which concepts are landing and which ones need another pass. It highlights opportunities to clarify tricky topics, add extra resources, or even build out new micro-learning modules to fill in common knowledge gaps. If you're looking for more ways to track audience behavior, check out our guide on essential video engagement metrics.
Viewer Drop-off Points: The Diagnostic Tool
Viewer drop-off points show you the exact moments where employees stop watching. This is easily one of the most powerful diagnostic user engagement metrics you have. A sudden dip at a specific timestamp is a huge clue that something is wrong with that particular segment of your training.
Maybe the content got way too technical without enough explanation, or perhaps a section was just plain boring. By analyzing these drop-off points in your Mindstamp analytics, you can perform surgical revisions. You can reword a tough explanation, add a clarifying visual, or break a long segment into smaller, more digestible parts to keep your learners hooked until the very end.
Turning Mindstamp Analytics into Actionable Insights
Knowing the core user engagement metrics is one thing, but the real magic happens when you turn those numbers into smarter training strategies. Let's be honest, raw data is just noise until you figure out what it's trying to tell you. Fortunately, Mindstamp’s analytics dashboard is built to make this part intuitive, helping you connect the dots between what your learners are doing and why.
Let's step away from theory and walk through a real-world corporate training scenario. Imagine you're a training manager who just rolled out a new safety protocol video for your warehouse team. The goal isn't just to get views; you need to make sure everyone actually understands and can apply the new procedures.
From Data Points to Development Decisions
After a week, you jump into your Mindstamp dashboard to see how things are going. Instead of just glancing at the view count, you dive straight into the engagement report. Right away, you spot a problem: there's a huge 35% drop-off rate right at the two-minute mark. This isn't just a random dip—it's a bright red flag telling you that something at that exact moment is causing people to check out or get lost.
Looking closer at the video timeline, you realize the drop-off happens during a particularly dense segment explaining a complex new piece of machinery. The data is telling a story: this section is a serious roadblock for your team.
The Mindstamp analytics dashboard lays this all out visually, making it incredibly easy to spot these kinds of trends and problem areas at a glance.

This kind of visual report immediately shows you where engagement is strong and where it's tanking, pointing you directly to the moments that need your attention.
Correlating Metrics for Deeper Understanding
But you don't stop there. You cross-reference that drop-off point with another key metric: the quiz question responses. You see that the question immediately following the machinery segment has a whopping 70% incorrect answer rate. Now, the picture is perfectly clear. The high drop-off and the terrible quiz performance are two sides of the same coin. The training content in that section just isn't hitting the mark.
This is the power of actionable analytics. You've moved beyond a vague "people aren't finishing the video" to a precise diagnosis: "Learners don't understand the new machinery procedure, causing them to disengage and fail the related knowledge check."
With this insight, your next step is obvious. Instead of sinking time and money into re-filming the entire hour-long video, you decide to create a short, targeted micro-learning module. This new two-minute video will focus only on that complex machine, using simpler language and clearer visuals. You can then link to this new video directly from the original training, giving your team extra support exactly where they need it. For a more detailed guide on finding this data, you can learn how to view interactive video data analytics and reports in Mindstamp.
It’s a lot like how modern email analytics strategies work; you’re not just looking at open rates, but at what people click on to understand what they truly care about. By transforming raw numbers into a clear story, you can make informed, strategic decisions that lead to better training and much better learning outcomes.
Interpreting Mindstamp Engagement Metrics
To help you get started, here’s a quick guide for turning the data you see in Mindstamp into concrete actions that can really move the needle on your training effectiveness.
Turning data into decisions doesn't have to be complicated. By focusing on a few key metrics and asking "why," you can quickly uncover powerful opportunities to make your training more engaging and effective for everyone involved.
Advanced Metrics for Deeper Learning Analysis
Once you’ve got a handle on the core metrics, it’s time to really dig in. While things like completion and interaction rates tell you if learners are showing up, advanced user engagement metrics tell you if they're actually getting it. This is where we move past just observing behavior and start measuring genuine understanding—the real goal of any training program.
Think of it this way: core metrics tell you an employee sat through the workshop. Advanced metrics tell you if they can now do the job right. For anyone in corporate training, this is where the magic happens. You get confirmation that your learning objectives are being met and that you've successfully transferred new skills.
Correct Answer Rates
This is probably the most direct way to measure what people are actually retaining. When you add questions directly into your Mindstamp videos, you’re not just hoping they’re paying attention—you’re checking their comprehension on the spot. The Correct Answer Rate is simply the percentage of learners who nail a specific question.
This metric is incredibly powerful. Let's say you see a consistently low score on a question about a critical safety procedure. That’s not a guess anymore; it's a data-backed alarm bell telling you the content right before that question isn't landing. You can pinpoint the exact moment of confusion and fix it.
Viewer Heatmaps
What if you could see your training video through your learners' eyes? That’s basically what a heatmap gives you. This visual tool shows you which parts of your video timeline are getting the most action—where people are re-watching, pausing, or clicking.
Heatmaps turn abstract viewing data into a visual story of engagement. A "hot" spot might show a really compelling point, but more often, it signals a section so dense that learners have to rewind and watch it a few times to fully grasp it.
This is huge because it helps you identify two critical things:
- Highly engaging content that’s clearly a hit and worth replicating in future videos.
- Areas of confusion that might need to be simplified, re-recorded, or explained in a different way.
By reading these visual patterns, you can tweak your content with surgical precision, making sure every single part is as clear and effective as possible.
Click-Through Rates on Resources
Great training rarely lives in a single video. You often need to point people to other materials—downloadable guides, links to company policies, or deep-dive technical docs. Your video can be the perfect gateway to these resources, but you have to know if your team is actually walking through the door.
The Click-Through Rate (CTR) on your embedded links and buttons tells you exactly that. A high CTR on a link to an "Advanced Troubleshooting Guide" is a great sign; it means learners are motivated and taking the next step. But a low CTR? That could mean the resource isn't relevant, or your call-to-action just isn't strong enough. Tracking this helps you see how well your entire learning ecosystem is working, not just one video.
How Engagement Metrics Prove Training ROI

This is where the rubber meets the road—where your data connects directly to dollars. User engagement metrics aren't just abstract learning stats; they're powerful business intelligence. They give you the hard evidence to show how your training programs are actually impacting the company's bottom line.
By keeping an eye on the right numbers, you can draw a straight line from a training video to better job performance, justified budgets, and a clear return on investment (ROI). It’s how you prove that learning and development isn't just a cost center—it's a critical part of what drives revenue.
From Knowledge Gaps to Sales Growth
Think about a sales team learning the ropes of a new product. Just knowing who watched the training video is pretty much useless. But what if you used interactive quizzes inside a Mindstamp video? Now you can track Correct Answer Rates on questions about key product features.
If you see a low score on a particular topic, you've instantly flagged a critical knowledge gap across the entire team. That's a powerful insight. It lets you deploy targeted follow-up training to fix that specific problem, without wasting anyone's time.
The result? A sales force that’s better informed, can confidently explain the product's value, handle objections with ease, and ultimately, close more deals. That measurable lift in sales for the new product is direct, undeniable proof of your training's financial impact.
This turns training from a passive, check-the-box activity into a hands-on performance-enhancement tool. If you want to dive deeper into connecting training efforts to financial outcomes, check out our guide on how to calculate the ROI on training.
Mitigating Risk with Auditable Data
Now, let's switch gears to compliance. When it comes to mandatory safety or regulatory training, proving comprehension isn't just nice to have—it's non-negotiable. High Completion Rates and Interaction Rates within your video provide auditable proof that employees didn't just see the material, they actively engaged with it.
This kind of data is gold during an audit. It shows your organization took tangible steps to ensure everyone understood the required information, which can dramatically reduce legal and financial risk.
It might seem different from marketing content, but the principle is the same. Businesses have learned from social media—where 65.7% of the global population are active users—that measuring engagement is essential to understanding what works. Whether you're selling a product or ensuring compliance, tracking interaction is how you prove you're effective.
At the end of a day, these metrics speak a language that executives understand. When you can walk into a meeting and show that higher engagement in safety training led to fewer on-site incidents, or that better product knowledge training correlated with a sales lift, you’re unequivocally proving your value and cementing L&D's place as a vital business function.
Your New Training Playbook: From Data to Development
So, where does this leave us? We've walked through everything from basic user engagement metrics like completion rates to the nitty-gritty analytics that tell you if your team really gets it. The main theme is pretty clear: just pushing out passive videos and hoping for the best doesn't cut it anymore if you're serious about building a skilled team. Real growth happens when learning is a two-way street—interactive, measurable, and flexible.
This whole approach flips the script on corporate training. It stops being a line item on a budget and starts becoming a genuine strategic advantage. When you use a platform like Mindstamp, you're not just making videos. You're engineering smarter, data-backed learning experiences. You can see exactly where employees are getting stuck, spot those knowledge gaps before they turn into bigger problems, and actually demonstrate the value your programs are delivering.
The bottom line is this: your data is the blueprint for your team's development. Every click, every answer, and every time someone rewinds a section is a clue that helps you build a smarter training strategy for tomorrow.
It's time to stop guessing. You have an open invitation to build a more switched-on, capable workforce simply by tuning into what your engagement data is telling you. Start treating your analytics less like a report card and more like your new training playbook for real, continuous growth.
Frequently Asked Questions
Switching from a simple "did they finish it?" mindset to one focused on real user engagement metrics can feel like a big leap, especially for Learning and Development (L&D) pros. It’s totally natural to have questions about what this looks like in practice. Let's tackle a few common ones.
What Is a Good Completion Rate for a Corporate Training Video?
This is the million-dollar question, isn't it? While every organization is different, a solid target for mandatory training is 85% or higher. If you're putting out optional or supplemental content, hitting anything above 50% is a huge win.
But here's the real secret: the most important number is your own. The goal is to set your own baseline and then work on improving it over time. If a critical compliance video is getting low completion rates, don't just shrug it off. Dive into your analytics, see exactly where people are dropping off, and then tweak that section to make it clearer or more engaging.
How Can I Improve My Video’s Interaction Rate?
Getting more clicks is all about making those interactions count. Instead of just slapping a generic "Click Here" button on the screen, make it a meaningful part of the learning experience.
- Ask thoughtful questions that make learners pause and think.
- Add clickable chapter markers so they can easily navigate longer videos.
- Embed links to resources right when you mention them, not at the end.
The goal is to weave interactions into the fabric of the video, making them a helpful guide rather than a jarring interruption. Play around with different Mindstamp features like hotspots and branching logic to discover what really clicks with your team.
Can User Engagement Metrics Replace Formal Assessments?
Think of them as a powerful sidekick, not a full replacement. Engagement metrics give you an incredible, real-time pulse on how well your team is grasping the material. Seeing high correct answer rates on in-video questions is a fantastic indicator of comprehension.
However, for official certifications or high-stakes compliance, you'll likely still need that separate, formal assessment. The beauty is that you can use the engagement data to get ahead of the game. You can spot learners who are struggling before they even get to the final exam and offer them extra support, setting everyone up for success.
Ready to stop guessing and start knowing what makes your corporate training effective? With Mindstamp, you can turn passive videos into active learning experiences and get the deep analytics you need to prove your impact. Start creating smarter training content today.
Get Started Now
Mindstamp is easy to use, incredibly capable, and supported by an amazing team. Join us!


Try Mindstamp Free


