

Mastering the Customer Retention Rate Formula for Training Success


The go-to formula for customer retention rate is CRR = ((E - N) / S) x 100. This simple calculation tells you the percentage of customers you've successfully kept over a certain amount of time. It's a surprisingly powerful tool for taking the pulse of your customer base and measuring their loyalty.
Why the Customer Retention Rate Formula Matters
Especially in the world of corporate training and development, the customer retention rate (CRR) is so much more than just a number on a spreadsheet. It’s a direct reflection of how valuable and engaging your learning programs really are.
Think of your training initiative like a bucket you’re constantly trying to keep full of skilled, motivated learners. The CRR formula helps you measure the leaks—in this case, learner drop-off—so you can see just how good you are at keeping that bucket full.
For any Learning and Development (L&D) pro who wants to show real impact, justify their budget, and build a true culture of learning, mastering this metric is non-negotiable. When learners stick around, it’s a clear signal that your training content is hitting the mark.
From Business Metric to Training Barometer
The standard formula has been a business staple for a long time, and for good reason: it ties directly to the bottom line. Even tiny improvements in retention can lead to huge financial gains. One widely cited analysis found that just a 5% bump in retention can boost profits by a staggering 25%–95%.
And when you consider that getting a new customer costs three to five times more than keeping an existing one, the argument for focusing on retention becomes crystal clear.
This same logic applies perfectly to corporate training. High learner retention translates directly to:
- Lower Reteaching Costs: When employees actually retain what they’ve learned, you don't have to spend time and money repeating the same modules.
- Higher Productivity: Engaged learners put their new skills to work faster, which boosts performance across the entire team.
- Better Employee Morale: Investing in quality training shows employees you care about their growth, which is a big win for job satisfaction.
The True Cost of Learner Churn
Losing a learner isn't just a lost data point; it represents a lost investment in that person's potential. Often, the challenge of addressing employee turnover is tied directly to the broader concept of retention. For a deeper dive, you might explore these proven employee retention strategies.
By tracking learner retention, you get a data-backed view of your training program's health. This allows you to make smarter, more informed decisions that keep your team skilled, engaged, and ready for whatever comes next.
Calculating Your Learner Retention Rate Step by Step
Alright, let's move from theory to actually crunching some numbers. This is where the customer retention rate formula really starts to show its value. We’ll walk through a real-world example in a corporate training setting to see how it works in practice. This isn't just about plugging numbers into a calculator; it's about seeing the story those numbers tell about your program's health.
Let's say your company just launched a new mandatory software skills course using an interactive video platform like Mindstamp. You want to see how well you kept learners engaged throughout the first quarter (Q1). To figure that out, you need just three key pieces of data.
Gathering Your Essential Data
First things first, you need to set a specific time period. For our example, we'll look at a standard business quarter, from January 1st to March 31st. The key here is consistency—always use the same time frame for your calculations so you can spot trends over time.
Once you have your timeframe, you’ll need to pull these numbers:
- Learners at the Start (S): How many employees were enrolled and active in the training on day one of the quarter (January 1st)?
- New Learners Acquired (N): How many new employees enrolled in the program during the quarter?
- Learners at the End (E): How many total employees were still enrolled and active on the last day of the quarter (March 31st)?
Think of these numbers as the basic building blocks for your calculation. They give you a clear snapshot of how stable your learner population was over those three months.
This visual shows you exactly how those three metrics fit together. You start with a group, add some new people, and end up with a final number.
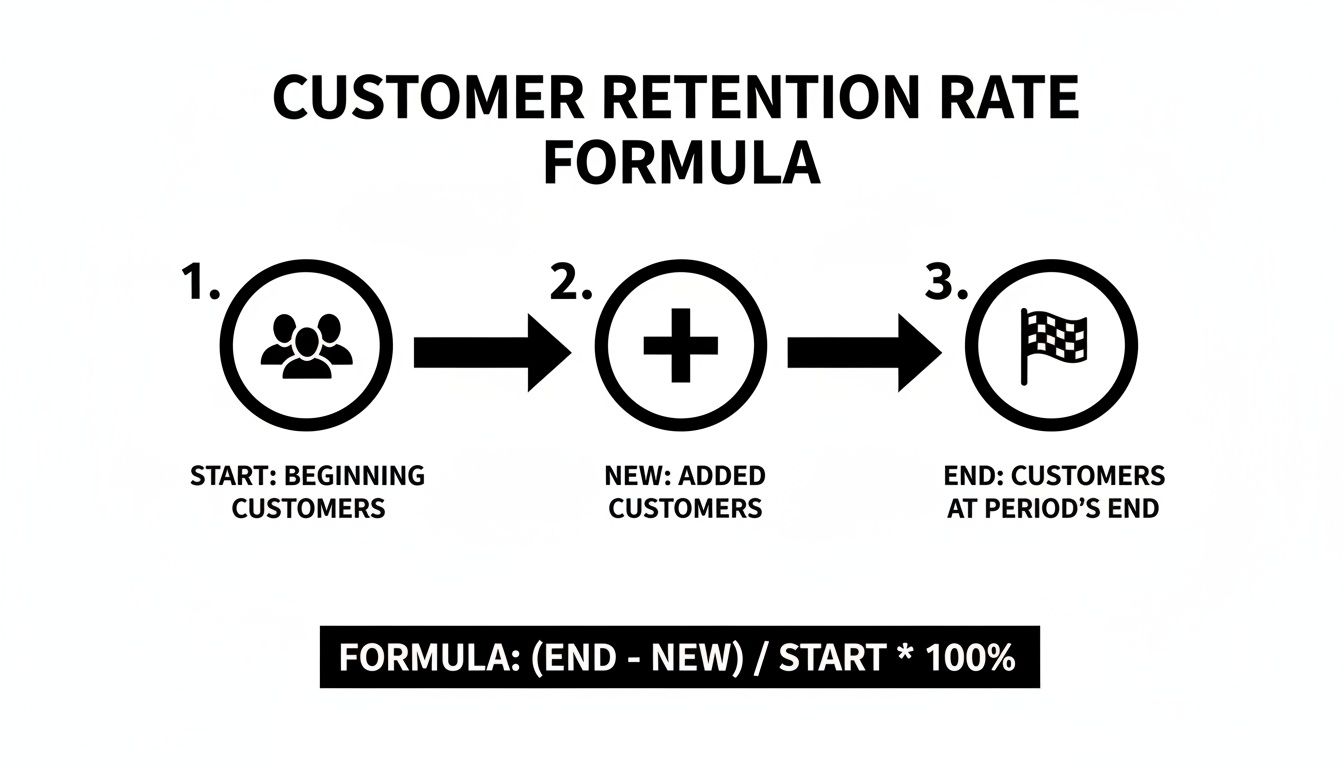
The trick, as the diagram shows, is that to measure retention, you have to remove the new learners from your final count. You're trying to find out how many of the original group stuck around.
A Practical Calculation Example
Let's plug in some actual numbers for our software training program. Imagine your data for Q1 looks like this:
- You started the quarter with 500 active learners (S = 500).
- During Q1, 75 new hires were enrolled (N = 75).
- By the end of March, you had 520 active learners in total (E = 520).
Now, we'll use the standard formula: CRR = ((E - N) / S) x 100.
Step 1: First, find out how many of your original learners are left. Subtract the new learners from your final total.
- 520 (Learners at End) - 75 (New Learners) = 445
Step 2: Now, divide that number by your starting total. This gives you the retention ratio.
- 445 / 500 (Learners at Start) = 0.89
Step 3: Finally, turn that decimal into a percentage by multiplying by 100.
- 0.89 x 100 = 89%
- Justify Budget Increases: Show leadership that your methods work and that more investment will lead to even better outcomes.
- Demonstrate Program ROI: Draw a clear line between high retention and improved performance, whether that’s hitting sales quotas or reducing support tickets.
- Advocate for Better Tools: Make a data-backed case for platforms like Mindstamp by showing how interactive features directly solve engagement and retention problems.
- In-Video Questions: Drop multiple-choice, free-response, or poll questions right onto the video timeline. This is perfect for reinforcing key ideas and checking comprehension on the spot.
- Clickable Hotspots: Make any object, person, or area of the screen clickable. Viewers can click to pull up a document, get more info, or jump to a related section of the video.
- Personalized Learning Paths: This is where it gets really powerful. Using branching logic, you can build custom journeys. If someone nails a question, they can skip ahead. If they struggle, you can direct them to a quick refresher.
- Viewer Drop-Off Points: Pinpoint the exact second a significant number of people bailed. Maybe the concept was confusing, or the section just dragged on too long.
- Question Performance: See how everyone is answering in-video questions. If 80% of people get a particular question wrong, that’s a clear signal that you need to explain that topic better.
- Click Engagement: Track which hotspots and buttons get the most action. This tells you what extra information your learners find most useful.
If you're below the benchmark: This is your cue to start digging. Are your modules too long? Is the content hitting the mark? This is the perfect time to dive into your user engagement metrics and pinpoint exactly where you're losing people.
If you're meeting the benchmark: Fantastic, you're doing things right! The next move is to figure out what's working so well and see how you can replicate that success across your other training programs.
If you're exceeding the benchmark: This is a powerful story to tell leadership. It's hard proof that your L&D strategy is working and builds a rock-solid case for investing more in the engaging tools and methods you're using.
- By Department: Are your sales team members retaining information from product training better than the marketing team?
- By Role: Do junior employees complete compliance training faster than senior management?
- By Start Date: How does the retention of employees who started in Q1 compare to those who started in Q3?
- Viewer Drop-Off Points: Pinpoint the exact seconds in your training videos where engagement plummets. This is a direct signal that the content at that moment is either confusing, boring, or irrelevant.
- Interaction Data: See how learners answer in-video questions or engage with clickable hotspots. If a specific question has a high failure rate, it’s a clear indicator that the concept needs to be explained more effectively.
- Completion Rates per Module: Track which specific courses or videos have the highest and lowest completion rates. This helps you identify your star content and diagnose any underperforming modules.
- For ongoing programs, like new hire onboarding or continuous skill-building, calculating retention monthly is a great idea. It gives you timely feedback you can act on quickly.
- For one-off or periodic initiatives, like annual compliance training or quarterly leadership workshops, looking at the numbers quarterly or yearly makes a lot more sense.
This table breaks down the entire process for our fictional corporate training platform, making it easy to see how each number fits into the final calculation.
So there you have it. Your Learner Retention Rate for Q1 is 89%. This tells you that you successfully kept 89% of the employees who started the quarter. The other 11% either left the company, changed roles, or simply stopped engaging with the training. That's a powerful piece of insight!
When to Use More Advanced Calculations
The overall retention rate is a fantastic starting point, but sometimes you need to dig a little deeper.
For example, what if you rolled out the training to the sales team in February? Lumping their data in with everyone else might hide some important details about how they're engaging with the material.
This is where cohort analysis comes in handy. A cohort is just a group of people who share a common trait, like their start date. By calculating the retention rate for just the "February Sales Team" cohort, you can see how that specific group is performing over time, completely separate from the rest of the company. It's a great way to see if certain training modules or onboarding methods are working better for some teams than others, allowing you to make targeted improvements.
Connecting Retention Metrics to Training Program Success
Figuring out your learner retention rate is a great start, but the real magic happens when you connect that number to how well your training programs are actually working. A high retention rate isn't just a number to feel good about; it’s hard proof that your training is hitting the mark. It shows your content is engaging, relevant, and genuinely helping your employees.
When people stick with and finish your training modules, it’s a clear signal that the material clicks with them and makes their jobs easier. That kind of sustained engagement is exactly what you want to see in a successful learning and development program. A strong retention rate tells a compelling story—one of value delivered and skills built.
On the flip side, a high drop-off rate is more than just a bummer. It’s an early warning system. It could be pointing to ineffective content, a clunky user experience, or a total mismatch between the training and what your team actually needs. If you ignore that signal, you're just throwing resources at programs that aren't getting results.
Turning Data into a Business Case
This is where you shift from just tracking numbers to using them to make strategic moves. As an L&D manager, your retention data is one of the best tools you have for building a solid business case, fighting for a bigger budget, and proving a real return on investment (ROI) to the higher-ups.
Picture this: you’re pitching a new leadership development program. Instead of just talking about how great it could be, you can walk in with data showing your current onboarding program has an 85% learner retention rate after you added interactive video modules. That single stat proves your team knows how to create effective content that people stick with, making your new proposal a much safer bet. For more ideas on this, check out our guide on how to measure training effectiveness.
The Financial Impact of Learner Retention
The link between retention and the bottom line is surprisingly direct. Research consistently shows that improving retention boosts revenue by increasing repeat business and lifetime value. While most of this talk is about customers, the same logic applies to your internal training. For example, returning customers are known to spend about 67% more than new ones, and just a 5% bump in retention can nearly double profitability in some cases. When you retain employees in a training program, you’re essentially boosting the "lifetime value" of that investment, creating more skilled, productive team members who directly contribute to growth. You can discover more insights about these retention statistics on Flowlu.com.
When you frame learner retention in terms of business impact—like lower retraining costs, faster skill development, and higher productivity—you elevate corporate training from a line item on a budget to a key driver of company growth.
At the end of the day, your customer retention rate formula gives you the hard numbers to back up your success stories. It empowers you to:
By getting a handle on these metrics and learning how to talk about them, you can strategically position corporate training as an essential part of the entire organization.
How to Boost Retention with Interactive Video Training
Knowing the customer retention rate formula is one thing, but actually improving your numbers? That’s a whole different ballgame. If you're seeing people drop off, the problem often isn't the content itself—it's the format. Standard, passive videos make it far too easy for learners to zone out.
The fix is to flip the script. Instead of a "lean-back" experience where your audience just consumes, you need to create a "lean-in" experience that demands their participation. This is exactly where interactive video shines, turning passive viewers into active learners.

From Passive Viewing to Active Learning
Let's be honest: traditional video training asks for sustained, uninterrupted focus, which is a big ask in any busy workplace. Interactive video breaks up that monotony and pulls learners back in right when their attention starts to fade.
Think about a standard compliance video. Instead of a 20-minute lecture that most people will tune out, what if you sprinkled in a few multiple-choice questions? Every few minutes, a quick check-in forces the viewer to process what they just saw and confirm they get it. It’s a small change with a huge impact.
Here are a few core features that make this happen:
These aren't just bells and whistles. They're smart, strategic tools designed to keep your audience engaged and actively participating in their own learning.
Practical Applications in Corporate Training
The real magic of interactive video is how flexible it is. You can use it to build way more effective training programs that employees actually finish—which directly juices your retention numbers.
Take new-hire onboarding, for example. You could build a "choose your own adventure" video where new employees click on the department they want to learn about first. This gives them a sense of agency and makes the material feel immediately relevant, making them far more likely to see it through to the end.
By turning training into an active dialogue instead of a passive monologue, you show respect for your learners' time and intelligence. That creates a better experience that directly leads to higher engagement and retention.
It’s also a game-changer for technical or software training. Instead of just showing someone how to use a tool, you can overlay clickable hotspots that prompt them to click the right button to move forward. This simulates a hands-on experience, which is proven to cement knowledge way more effectively than just watching. The core principle—reducing churn through active engagement—is universal, as seen in tips like these 10 actionable mobile app retention strategies.
Using Analytics to Continuously Improve
One of the biggest wins of using a platform like Mindstamp is the data you get back. You’re no longer guessing why people are dropping off; you have a dashboard telling you exactly when and where it's happening.
This kind of insight is gold for refining your content and boosting your learner retention rate over time.
Mindstamp’s analytics can show you:
By checking in on this data regularly, you can get into a rhythm of continuous improvement. See a big drop-off at the 7-minute mark? Pop in an engaging question right before it to pull viewers back in. It’s a data-driven way to make small tweaks that produce a big lift in your completion and retention rates. To explore this further, check out the benefits of investing in interactive video for training and see how it can transform your approach.
Interpreting Your Retention Rate with Industry Benchmarks
So you've run the numbers using the customer retention rate formula, and now you have a percentage staring back at you. What does it actually mean? A "good" retention rate isn't some magic, universal number. It’s a moving target that shifts wildly from one industry to the next, and understanding that context is everything.
Without benchmarks, your retention rate is just a number without a story. Knowing how you stack up against your peers is what helps you set achievable goals, make a strong case for your training strategy, and figure out if you're leading the pack, keeping pace, or falling behind.
Setting Realistic Expectations for Corporate Training
The corporate training world has its own rhythms. Think about it: a mandatory, subscription-based compliance course is going to behave very differently than a one-off, voluntary skills workshop. The first will likely have sky-high retention out of necessity, while the second has to earn every single returning learner by proving its value and keeping them engaged.
For L&D pros using interactive video platforms like Mindstamp, these nuances are critical. The goal isn't just to get people to stick around; it's to blow the engagement levels of old-school, passive training methods out of the water.
Comparing Your Numbers to Industry Averages
Retention benchmarks are all over the map, depending on the sector. For instance, you'll see industries like media and professional services hovering around an 84% average retention rate. Meanwhile, sectors like hospitality and travel were closer to 55% in the same period. It's a huge difference.
When you zoom in on digital learning products, the picture gets even more specific. A comprehensive look at customer retention rates shows that digital products tend to keep about 39% of users after one month and roughly 30% after three. So, if your interactive training module hits 40% retention or more in that first month, you're officially beating the average and have a seriously competitive program on your hands.
All this data drives home one crucial point: context is king. A 60% retention rate could be absolutely stellar in one field but a red flag in another.
Understanding industry benchmarks transforms your retention rate from a simple metric into a strategic tool. It allows you to have informed conversations about performance and prove that your interactive training methods are delivering superior results compared to the norm.
Using Benchmarks to Drive Strategy
Once you have a clear idea of where you stand, you can start making much smarter decisions about your training strategy.
By comparing your results to industry standards, you move past just calculating a number. You start to truly understand what your retention rate means for your organization's growth and your people's development.
Common Mistakes to Avoid When Tracking Learner Retention
Calculating your learner retention is a huge step forward, but the customer retention rate formula is only as good as the data you feed it. I've seen a lot of well-meaning training teams get tripped up at this stage, leading to skewed numbers and flawed conclusions about their programs.
Let's walk through some of the most common mistakes so you can track your progress with confidence and get a truly accurate picture.
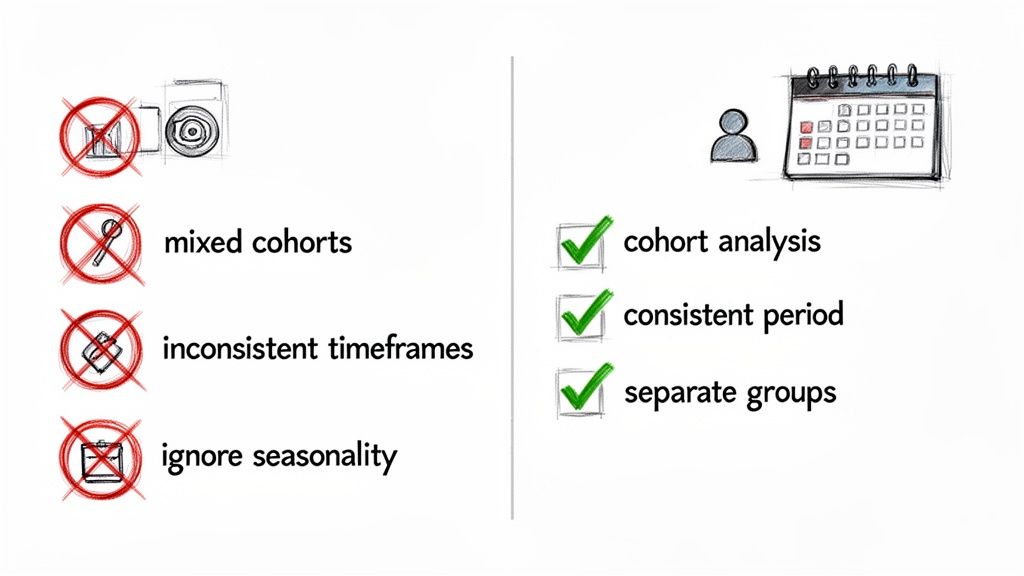
A frequent error is calculating retention over inconsistent timeframes. Comparing monthly retention in Q1 to quarterly retention in Q2 is like comparing apples and oranges—the data simply won't reveal any meaningful trends. You have to maintain consistency, whether you decide to measure weekly, monthly, or quarterly.
Another major pitfall? Lumping all your learners into one giant group. Your audience is not a monolith.
Treating All Learners the Same
Think about it: new hires in their first week of onboarding have completely different needs than senior leaders taking an advanced strategy course. Measuring them all together in one big pool will hide critical insights and can even make successful programs look like they’re failing.
For instance, a low overall retention rate might be caused entirely by a single, poorly designed onboarding module that’s dragging down the average. Without segmenting your learners, you'd never know where the real problem is.
The fix is to always segment your learners into logical cohorts. This lets you isolate variables and understand the true performance of specific training initiatives.
By separating learners into distinct groups, you move from a blurry, high-level number to a sharp, actionable story. This focused view reveals exactly which training programs are hitting the mark and which need a second look.
Overlooking the Power of Deeper Analytics
Perhaps the biggest mistake is fixating on that one overall retention number while ignoring the rich story hidden in deeper analytics. A single percentage point doesn't tell you much. It tells you what happened, but offers zero clues as to why.
This is where the detailed analytics inside a platform like Mindstamp become so valuable. Instead of just knowing that 20% of learners dropped off, you can see the exact moment in a video where they lost interest.
Here are a few key analytical insights you should be tracking:
By focusing on these granular details, you can stop guessing and start making data-driven improvements. This shifts your whole approach from reactive problem-solving to proactive program optimization, ensuring your learner retention rate is built on a solid foundation of engaging, effective content.
Frequently Asked Questions
Once you get the hang of the customer retention rate formula, you'll start seeing it everywhere. Let's tackle some of the common questions L&D pros run into so you can start using this metric with confidence.
What Is the Difference Between Retention Rate and Churn Rate?
Think of retention and churn as two sides of the same coin. They’re perfect opposites.
If you managed to keep 85% of your learners engaged in a program over a quarter, that’s your retention rate. By default, that means you lost the other 15%. That 15% is your learner churn rate.
It’s a simple inverse relationship. You can always figure one out if you know the other: Churn Rate = 100% - Retention Rate. This gives you two different but equally powerful ways to talk about the health of your training programs.
How Often Should I Calculate My Learner Retention Rate?
Honestly, there’s no single correct answer here. The best frequency really depends on the rhythm of your training programs and what you’re trying to achieve. The most important thing is to be consistent.
The key is to pick a timeframe that lines up with your training schedule and stick to it. That consistency is what will let you spot meaningful trends and see if the changes you're making are actually working.
Can My Retention Rate Be Over 100 Percent?
When we're talking about the number of learners, the answer is a firm no. You can't retain more people than you started with. A 100% retention rate is the absolute peak—it means you didn't lose a single learner.
Now, you might hear people in other departments (especially SaaS) talk about "net revenue retention" being over 100%. That's a different beast. It happens when existing customers spend more money by upgrading or buying new services, making the revenue from that starting group grow. But for L&D purposes, where we’re focused on people, 100% is the ceiling.
Ready to turn these insights into action? Mindstamp makes it incredibly simple to build engaging interactive video training that learners actually want to finish. You can transform your passive content into an active learning experience and watch those retention rates climb.
Get Started Now
Mindstamp is easy to use, incredibly capable, and supported by an amazing team. Join us!


Try Mindstamp Free


