

Mastering the Retention Rate Calculator for Training and Development


A retention rate calculator is a tool that tells you the percentage of employees who stick around over a set period. But if you're in learning and development (L&D), this isn't just some number for an HR report—it's a direct reflection of your training program's real-world impact.
Simply put, a high retention rate often means your training is hitting the mark. It shows you’re empowering employees with new skills and making them feel like the company is truly invested in their professional growth.
Why Retention Metrics Are Your Training Superpower
Let's stop thinking about retention as a sterile, once-a-year metric buried in a spreadsheet. For corporate training and development, retention data is your most powerful feedback loop. It tells you whether your investment in people is paying off, not just in new skills, but in genuine loyalty.
When you track retention, you’re really taking the pulse of your learning culture. It’s a powerful way to connect what you do in L&D directly to tangible business outcomes. Think about it: a team that feels stagnant is a team that starts polishing up their resumes. Your training is the antidote.
Beyond a Single Number
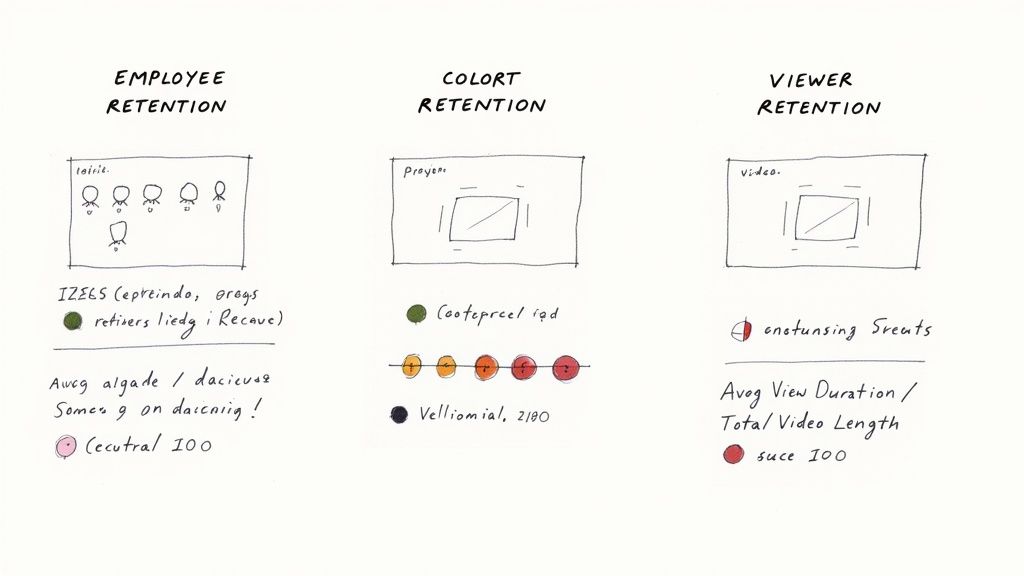
In the world of L&D, retention isn't a single metric; it’s a story told from a few different angles. To get the full picture of your program's effectiveness, you need to look at three key types:
Employee Retention: This is the big one. Are the people who complete your training programs staying with the company? High retention among this group is a strong signal that they see a future with you, largely because of the development opportunities you’re providing.
Knowledge Retention: This is where things get interesting for L&D. Do your people actually remember and apply what they learned weeks or months after a course ends? If knowledge retention is low, it doesn’t matter how slick your training is—it isn't sticking.
Viewer Retention: For modern, video-based training, this is non-negotiable. Are learners watching your training videos all the way through? A massive drop-off halfway through a compliance video is a screaming sign that the content is missing the mark. This is where a platform like Mindstamp is invaluable, giving you real-time data on exactly what captures—and loses—your audience's attention during their learning journey.
These metrics all feed into each other. Engaging video content (high viewer retention) leads to better learning outcomes (high knowledge retention). That, in turn, helps employees feel valued and competent, which ultimately boosts overall employee retention.
Viewing retention through these three lenses transforms it from a passive number into an active diagnostic tool. You stop asking who left and start understanding why your best people stay.
Connecting Training to Business Wins
When you have a solid grasp on your retention rates, you can draw a straight line from your L&D budget to bottom-line results. The logic is simple: effective corporate training cuts down on costly turnover and builds a more capable, productive workforce.
This is why a retention rate calculator has become so essential for gauging workforce stability. As companies lean more into data-driven strategies, these tools are key for optimizing talent and dodging the high costs of churn. You can see this trend in recent workforce surveys, which show just how critical these calculations have become for strategic L&D.
Of course, a calculator is just one piece of a much larger puzzle. Understanding how to measure training effectiveness is the real goal. By measuring who stays, what they remember, and how they engage with learning content, you prove the immense value of your work and reframe training not as a cost center, but as a strategic investment in the company’s greatest asset: its people.
Your Hands-On Retention Rate Calculator and Template
Theory is great, but progress happens when you start putting numbers to work. To help you jump straight from concepts to action, we’ve put together a couple of practical tools designed specifically for Learning and Development (L&D) pros. You don’t need to be a data guru to use them—they’re built for clarity and immediate use.
First up is a comprehensive, downloadable Google Sheets template. Think of it as more than just a single calculator; it’s a multi-faceted tool built to look at retention from the different angles that matter most in corporate training. We've also got an embedded interactive calculator right here on the page for those times you need a quick answer without opening up a new spreadsheet.
Both tools are pre-filled with sample data. This way, you can see exactly how the formulas click into place and how your own L&D data should be structured before you even touch a thing. The whole point is to get you measuring what matters, with confidence, right away.
This simple flow shows how strategic training directly fuels retention, which in turn leads to major business wins.
The key takeaway here? Retention isn't just some isolated HR metric. It's a direct result of successful employee development and a powerful driver of your company's success.
Your All-in-One Google Sheets Template
Our downloadable template is your central hub for tracking the most important training-related retention metrics. We’ve organized it into three separate tabs, with each one serving a specific purpose in your L&D strategy. This setup lets you move from a high-level view to a really granular analysis without getting lost.
Here’s what’s inside:
Overall Employee Retention: This tab helps you track the big picture. Just plug in your total number of employees at the start and end of a period—say, quarterly or annually—and you'll get your company-wide retention rate. This is your baseline, the core metric you can use to measure the impact of broad training initiatives.
Training Cohort Retention: This is where things get really interesting for L&D. This tab is designed to follow a specific group of employees who went through a training program together, like a new manager workshop or a sales onboarding class. By tracking this cohort over time, you can directly measure if your training is actually helping to keep key talent around.
Video Viewer Retention: In the age of digital learning, knowing if people are actually watching your training videos is crucial. This tab uses the viewer retention formula to measure how much of your video content people are sticking around for. It's an essential tool if you're using video for onboarding, compliance, or skills training. A low score here is a clear signal that your content might need a refresh to be more engaging.
By separating these metrics, you can pinpoint exactly where your training is hitting the mark and where it might be falling short. For instance, you could find high overall retention but low retention within a specific cohort, flagging a potential issue with that particular program.
How to Use the Google Sheets Template
Getting started is straightforward. Once you make a copy of the template, you’ll find clear instructions and placeholder data in each tab. Your only job is to swap out our sample numbers with your own.
Let’s walk through a couple of real-world scenarios for a corporate trainer.
For the Training Cohort tab, imagine you ran a leadership development program for 25 newly promoted managers that wrapped up on January 1st. You’d enter "25" as your starting number. If, by the end of the year, 23 of those managers are still with the company, you can instantly see the direct retention impact of that specific program.
Over on the Video Viewer Retention tab, let's say you have a 10-minute compliance video. You check your Mindstamp analytics and see the average view duration is 6 minutes. Just plug those two numbers in. The template will automatically calculate a 60% viewer retention rate. This immediately tells you that you're losing a big chunk of your audience before the end, giving you actionable data to investigate why and improve your learning content.
The Quick Interactive Calculator
For those moments when you just need a fast answer, we’ve embedded our interactive calculator below. It's perfect for quick "what-if" scenarios or for calculating a single metric on the fly during a team meeting. Just pop in your numbers, and it’ll give you an instant retention rate percentage.
Crunching the Numbers on Your Three Core Training Retention Rates
Knowing what retention is feels good, but being able to actually calculate it is where the magic happens. Let's get our hands dirty and walk through the exact formulas you'll need to measure the real-world impact of your corporate training. We'll focus on the three retention rates that matter most for L&D pros and use some practical examples to see them in action.
These numbers are what connect your training initiatives to tangible business results. They give you the hard data to prove your program's value to anyone who asks.
Measuring Overall Employee Retention
Think of this as your baseline—the big-picture view of your workforce's stability. It simply tells you what percentage of employees stuck around over a certain period. While it’s a broad metric, it’s the ultimate benchmark you'll compare your more specific, training-focused numbers against.
The formula itself is pretty direct:
Employee Retention Rate = ((Ending Number of Employees - Number of New Hires) / Starting Number of Employees) x 100
Let's say your company kicked off the year with 500 people. Throughout the year, you brought on 50 new hires, and by the end of December, you had a total of 510 employees.
- Starting Number: 500
- Ending Number: 510
- New Hires: 50
Plugging those in, we get: ((510 - 50) / 500) x 100 = (460 / 500) x 100 = 92%.
So, your annual employee retention rate is 92%. This is your starting point, the context for everything else we're about to calculate. While this formula is standard, the core concept can be adapted. If you're curious about a slightly different take, we have a guide that explains how to calculate customer retention rate, and you'll see the principles can be applied to almost any scenario.
Tracking Specific Training Cohort Retention
This is where you can start to really see your L&D impact shine through. Instead of looking at the whole company, you zoom in on a specific group—a cohort—that went through one of your training programs. This lets you directly measure if your investment in their skills helped convince them to stay.
The formula for cohort retention is even simpler:
Cohort Retention Rate = (Number of Cohort Members Remaining / Original Number of Cohort Members) x 100
Imagine you ran an intensive upskilling program for your engineering team. Twenty employees took part over six months. A year later, you check in to see how many of them are still on the payroll.
- Original Number of Cohort Members: 20
- Number of Cohort Members Remaining: 18
The math is quick: (18 / 20) x 100 = 90%.
That program has a 90% cohort retention rate. Now, if your company-wide turnover rate was, say, 15% (meaning an 85% retention rate), you can start building a strong case that your training initiative made a real difference in keeping that valuable technical talent around.
The Goldmine of Video Viewer Retention
In today’s training world, video is king. But it's one thing to create a training video; it's another thing entirely to get people to actually watch it. Video Viewer Retention might just be the most powerful, real-time metric for L&D because it tells you exactly how engaging your training content is, second by second.
Here’s how you calculate it:
Video Viewer Retention Rate = (Average View Duration / Total Video Length) x 100
This metric is baked right into interactive video platforms like Mindstamp, where detailed analytics are part of the package. Let's say you just launched a new 15-minute (900 seconds) onboarding video on company culture. A month in, you pop into your Mindstamp dashboard and see the average viewer watched for 12 minutes (720 seconds).
- Average View Duration: 720 seconds
- Total Video Length: 900 seconds
The calculation is: (720 / 900) x 100 = 80%.
That's an 80% viewer retention rate, which is a fantastic signal of engagement. But the real power is that Mindstamp can show you where people are dropping off. You can pinpoint the exact moments that are boring, confusing, or just too slow, and then go in and fix them to improve the learning experience.
A low viewer retention rate is your canary in the coal mine for ineffective training. If learners aren't even making it through the video, you can bet they aren't absorbing the knowledge. This metric gives you actionable insights to solve problems before they derail your learning outcomes.
For a broader look at how these kinds of metrics work in a B2B setting, this guide on customer retention rate calculation is a great resource, as many of the core ideas are surprisingly similar.
Retention Rate Formulas for L&D
Here’s a quick-reference table to keep these formulas handy. Think of it as your cheat sheet for proving the value of your corporate training programs.
Having these calculations in your back pocket allows you to move from talking about training activities to demonstrating tangible business impact.
Interpreting Your Data and Sidestepping Common Mistakes
Getting your retention rates calculated is just the first step. The real work—and where you’ll find the most value—is figuring out the story those numbers are telling you. A percentage on a spreadsheet is just a piece of data; turning it into an insight that actually improves your training strategy is what really makes a difference.
Once you have your numbers, the immediate question is always, "So... is this good?" The answer is never a simple yes or no. A "good" retention rate is entirely dependent on your industry, the specific roles you're training, and even what’s happening in the broader economy.
What Is a Good Retention Rate?
While every company's situation is unique, you can use some general benchmarks to get your bearings. Most organizations aim for an overall employee retention rate of 90% or higher, which translates to an annual turnover of 10% or less. But this can swing wildly between industries. You'd expect higher turnover in tech or retail compared to government jobs, for example.
To get a clearer picture, here are a few L&D-specific benchmarks to consider:
- Overall Employee Retention: Hitting anything above 90% is widely considered excellent.
- Training Cohort Retention: The key here is to compare this number directly to your company-wide rate. If your new hire cohort's retention is 5-10% higher than the company average, that’s a powerful sign that your onboarding and training are working.
- Video Viewer Retention: For internal training videos, a viewer retention rate of 70-85% is fantastic. If you’re seeing rates dip below 50%, it’s a red flag that your content isn't connecting with learners and needs a rethink.
The goal isn't just hitting some arbitrary number. It's about establishing your own baseline, setting realistic goals for improvement, and then using that data to prove your L&D efforts are actually moving the needle.
The Pitfalls L&D Teams Must Avoid
Raw data can be incredibly misleading if you aren't careful. I’ve seen many well-intentioned L&D pros fall into a few common traps that muddy their analysis and lead to the wrong conclusions. Getting ahead of these mistakes is the key to making sure your insights are accurate and actionable.
One of the most frequent errors is analyzing data over inconsistent time frames. Comparing a quarterly cohort retention rate from this year to an annual one from last year is like comparing apples and oranges—it just creates noise, not insight. Always make sure your comparison periods are aligned, whether it's month-over-month, quarter-over-quarter, or year-over-year.
Another big mistake is failing to segment your results. An aggregate retention number for all your trainees can easily hide serious problems simmering under the surface. Imagine your new manager program has a stellar 95% cohort retention rate, but your new sales hires are leaving at a rate of 30% within six months. A blended average would completely obscure the urgent need to overhaul your sales onboarding. You have to segment by department, role, or training program to see what's really going on.
But maybe the biggest oversight of all is focusing only on employee turnover while ignoring engagement. Sure, you might be keeping an employee in their seat, but if they're disengaged and unproductive because the training fell flat, is that truly a win? This is exactly why viewer retention in platforms like Mindstamp is so important. It’s a direct pulse on engagement that tells you if learners are actually paying attention and absorbing the material. We put together a detailed guide on training effectiveness measurement that offers more ways to get a complete picture.
From Data to Decisions
Once you’ve calculated your rates and steered clear of the common pitfalls, it’s time to turn those numbers into an actual plan. Your retention data should be the fuel for a continuous cycle of improvement across all your corporate training.
Here’s a simple framework to put your data to work:
- Identify the Outliers: Scan your data for the numbers that jump out, both good and bad. Is one department’s retention rate way lower than the rest? Did a particular training video see a massive viewer drop-off at the 3-minute mark? These are your starting points.
- Ask "Why?": This is the most important step. Why did viewers bail at that exact moment? Was the content suddenly too technical, or was the speaker just boring? Why is the sales cohort leaving? Is the training completely misaligned with the reality of their day-to-day job? Dig deep here.
- Formulate a Hypothesis: Based on your "why," come up with a testable theory. For instance: "We think viewers are dropping because the compliance section is a dense, 10-minute monologue. If we break it into three shorter, interactive micro-videos, we can improve viewer retention."
- Test and Measure: Go implement your change, then track the results using the very same metrics. Did the new videos have a higher completion rate? Did the next sales cohort's retention improve after you tweaked the onboarding content?
Following this process transforms your retention data from a simple report card into a powerful diagnostic tool. It helps you make smarter, data-driven decisions that not only improve retention but also create far more effective and engaging learning experiences for every single employee.
How Interactive Video Elevates Your Retention Rates
Calculating your retention rates is a crucial first step. It gives you a baseline, a clear picture of where you stand. But the real work isn't just measuring retention; it's actively improving it. This is where you shift from simply analyzing data to becoming a strategic L&D leader, and it’s where a tool like Mindstamp can be a game-changer.
Let's be honest: traditional, passive video training is often a one-way ticket to low viewer and knowledge retention. When employees are asked to just sit and watch a linear presentation, minds wander, multitasking kicks in, and key learning points get lost in the shuffle.
Interactive video completely flips this dynamic. It turns passive viewing into an active, participatory learning experience. This isn't just a nice-to-have feature; it fundamentally changes how learners process information. When people have to interact with training content—by answering a question, making a choice, or exploring a topic—their focus and comprehension skyrocket.
From Passive Viewing to Active Learning
Interactive features transform a one-way information dump into a two-way conversation. This is the direct antidote to the disengagement that plagues so much corporate training. Instead of just pressing play and zoning out, employees are pulled right into the material.
Here are just a few ways Mindstamp's interactive elements make this happen:
- Embedded Questions: You can drop multiple-choice, open-ended, or even video response questions directly into the video timeline. This simple act forces learners to pause, think, and apply what they’ve just seen, cementing that knowledge in real-time.
- Personalized Learning Paths: Using branching logic, you can create a "choose your own adventure" learning experience. A sales rep can jump to sections on handling objections, while a marketer focuses on product positioning—all within the same video. It makes the content far more relevant and respectful of everyone's time.
- In-Video Navigation: Features like chapters and clickable hotspots let learners skip to the sections they need or easily revisit tricky topics. Giving them control over their own learning is a massive driver of engagement.
By making learning an active process, you aren't just bumping up a viewer retention metric. You're creating the very conditions necessary for true knowledge retention. An engaged mind is a mind that learns.
Using Analytics to Pinpoint Engagement Drops
One of the most powerful aspects of an interactive video platform is the data you get back. A standard video gives you one blunt metric: view count. Mindstamp’s analytics, on the other hand, provide a second-by-second heatmap of viewer engagement. This is where you can stop guessing and start knowing.
You can literally see where engagement spikes and where it falls off a cliff.

The insights from a report like this are immediately actionable. You can see the exact moment a huge chunk of your audience got bored and clicked away, giving you a crystal-clear mandate to fix that segment of your training.
Imagine your analytics show a massive viewer drop-off three minutes into your new cybersecurity training video. You scrub to that section and realize it’s a dense, five-minute monologue on data encryption policies. You've found your problem.
Armed with this data, you can make targeted improvements:
- Break it up: Replace that long monologue with three punchy, 90-second micro-videos.
- Add interaction: Insert a quick "check your understanding" question after each short segment.
- Provide context: Add a clickable hotspot that links to the full policy document for those who want the details, without bogging down the main video for everyone else.
By making these data-driven tweaks, you can re-launch the video and watch your retention rate climb. This cycle of measuring, analyzing, and improving is the key to creating training that actually sticks. To dig deeper, check out our guide on the benefits of investing in interactive video for training.
The Ripple Effect on Employee Retention
The link between effective training and overall employee retention is direct and undeniable. When employees feel their company is genuinely investing in their growth with high-quality, engaging training, their sense of value and loyalty goes through the roof. Nobody wants to work at a place where training feels like a chore to be endured.
On the flip side, forcing employees through boring, ineffective training sends a clear message: the company is just checking a box. This breeds cynicism and disengagement, which are often the first steps an employee takes on their way out the door.
Ultimately, by using a tool like Mindstamp to boost viewer and knowledge retention, you’re fueling a powerful positive feedback loop. More effective training leads to more competent, confident employees. Those employees perform better, feel more valued, and are far more likely to stick around. Your retention rate calculator will show it—not just for your training cohorts, but for the entire organization.
Common Questions About Retention Rate Calculators
Even with the right formulas and a handy calculator, you're bound to run into a few practical questions when you start digging into retention metrics for your training programs. Let's tackle some of the most common ones L&D professionals ask.
How Often Should I Calculate Training Retention Rates?
There’s no one-size-fits-all answer here—it really depends on what you're measuring within your training and development strategy.
When you're looking at big-picture employee retention tied to your training programs, a quarterly calculation usually hits the sweet spot. It's frequent enough to catch important trends before they snowball, but not so often that you're getting lost in the noise of normal monthly ups and downs.
But for something like video viewer retention, you need a much quicker feedback loop. After you launch a new training video with a tool like Mindstamp, I'd recommend checking the analytics weekly for at least the first month. This lets you spot engagement drop-offs right away and tweak the content before it affects a wider audience's learning.
What Is the Difference Between Retention Rate and Turnover Rate?
Think of them as two sides of the same coin. They both paint a picture of workforce stability, just from different angles.
- Retention Rate: This is the good news. It’s the percentage of your people who stayed with the company over a certain period.
- Turnover Rate: This is the metric that signals a potential problem. It's the percentage of employees who left during that same time.
So, if your annual retention rate is 92%, your turnover rate is simply 8%. While they're just inverses of each other, I've found that framing the conversation around retention is far more productive in an L&D context. It forces you to focus on what you're doing right—the training and development that makes your best talent stick around.
Focusing on retention shifts your strategic mindset from just plugging a leaky bucket to building a stronger, more resilient container for your talent through effective corporate learning.
Can This Calculator Be Used for Customer Retention?
Absolutely. While this guide is focused on L&D and training, the basic math behind a retention rate calculator is universal. The core principle is always the same: tracking how many people stick with you over time.
It doesn't matter if you're measuring employees who stay after a big development program or customers who keep their subscription after onboarding. You still define your group, set your time frame, and calculate the percentage that remains. You’ll find the strategies for digging into the "why" and making improvements are surprisingly similar, too.
Ready to stop just measuring retention and start actively improving it? Mindstamp gives you the tools to create engaging, interactive training videos that command attention and drive knowledge retention. See how our detailed analytics can transform your L&D strategy.
Get Started Now
Mindstamp is easy to use, incredibly capable, and supported by an amazing team. Join us!


Try Mindstamp Free


