

How to Calculate Customer Retention Rate


Calculating your customer retention rate is pretty straightforward. You just take your total number of customers at the end of a set period, subtract any new customers you picked up during that time, and then divide that number by the customers you started with. Multiply by 100, and there's your percentage. It's a simple formula, but for any business in the corporate training and development space, it's a vital health check.
Why Customer Retention Matters in Corporate Training

Before we jump into the nitty-gritty of how to calculate customer retention rate, let's talk about why this metric is such a big deal, especially in the corporate training world. It’s a different ballgame here. Unlike a B2C model where losing a customer means one less subscriber, in the B2B training space, a single "customer" is an entire organization. That could mean hundreds or even thousands of employees.
When a corporate client decides to renew their subscription to a platform like Mindstamp, it’s a massive vote of confidence. It’s a clear signal that your interactive training modules aren't just getting clicks—they're delivering real, tangible results. A high retention rate is the best proof you can have that your content is essential to their success.
Proving Your Indispensable Value
Think of retention as more than just a number on a dashboard; it’s a direct reflection of your content's real-world impact. A company simply won't keep investing in a training solution unless they see clear benefits, whether that's better employee performance, improved compliance, or faster onboarding. Your retention rate is what puts a number on that success.
For example, a strong retention rate tells you that your training programs are helping clients achieve things like:
- Greater Employee Engagement: People actually stick with interactive video content. It holds their focus and helps them absorb more information, which is a huge selling point for any HR or L&D manager.
- Measurable Skill Development: When clients see their teams putting new skills into practice—skills they learned on your platform—renewal becomes a no-brainer.
- Predictable Training Outcomes: Consistent, high-quality training delivers reliable results, turning your service from a "nice-to-have" into a critical piece of their operational strategy.
In the corporate training sector, customer retention isn't just about preventing churn; it’s the ultimate validation that your educational content is driving meaningful business outcomes for your clients.
Building Strategic Partnerships
At the end of the day, strong retention moves your business relationship beyond a simple vendor-client dynamic. You become a long-term partner. When a client sticks with you year after year, it’s because you've become a trusted advisor in their employee development journey.
To go deeper on this, you can explore the relationship between customer retention and customer loyalty in our guide. And if you're looking for practical ways to keep those clients around, check out this comprehensive guide on how to increase customer retention.
The Core Formula for Customer Retention
Calculating your customer retention rate feels a lot more complicated than it actually is. At its heart, it’s a straightforward formula that cuts through the noise to tell you one thing: how good are you at keeping the clients you already have?
Think of it as a clear snapshot of your business's health. It intentionally ignores new sales to give you a true measure of loyalty and satisfaction among your existing customer base.
Breaking Down the Variables
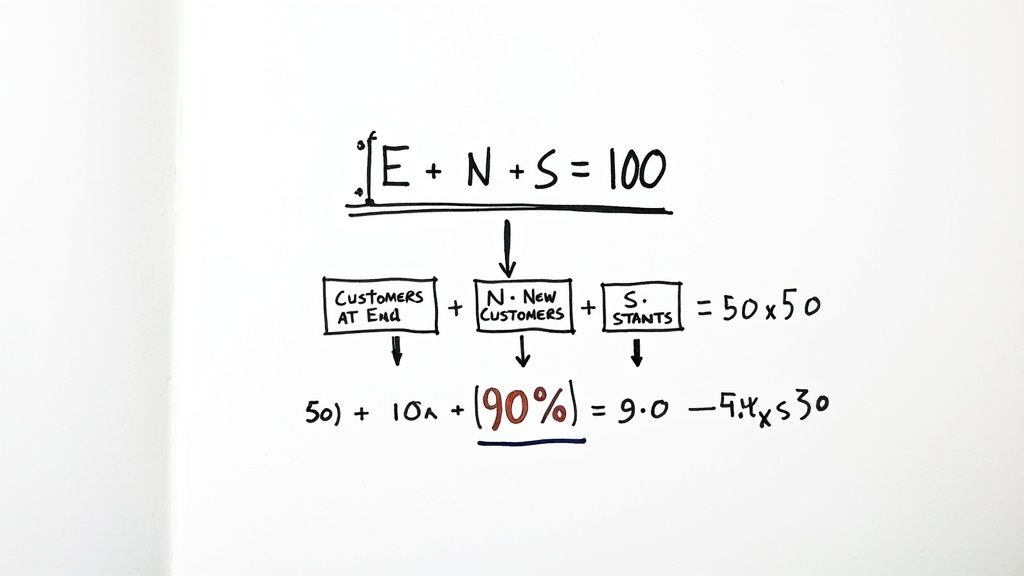
To figure out your retention rate, you just need three numbers for whatever period you're measuring (a quarter, a year, you name it). The formula looks like this: [(E - N) / S] x 100.
Let's quickly unpack what each of those letters means.
- E stands for the number of customers you have at the End of the period.
- N represents the New customers you signed up during that same period.
- S is the number of customers you had at the Start of the period.
The magic happens when you subtract the new customers (N) from your final count (E). This simple step isolates the group of clients you're really measuring for retention—the ones who were with you from the beginning.
Here's a quick reference table to keep the variables straight.
Customer Retention Formula Components Explained
This table makes it easy to see exactly what numbers you need to pull before you start crunching them.
The whole point of the customer retention formula is to remove the distraction of new business. This gives you an honest look at how many of your original clients are sticking around, which is a powerful indicator of the value and experience you’re providing.
Putting the Formula into Action
Let's walk through a real-world example. Imagine you run a corporate training company that uses a platform like Mindstamp for interactive video modules. You want to calculate your retention rate for the last quarter.
Here’s the data you pulled:
- You started the quarter with 50 corporate clients (S).
- You onboarded 10 new clients over the last three months (N).
- When the quarter ended, your total client count was 55 (E).
Now, we just plug those numbers into our formula:
[(55 - 10) / 50] x 100
First, subtract the new clients from your final total to find out how many of your original clients are left.
55 - 10 = 45
So, 45 of your original 50 clients were still active at the end of the quarter. Good start.
Next, divide that number by the number of clients you started with.
45 / 50 = 0.9
Finally, multiply by 100 to turn that decimal into a percentage.
0.9 x 100 = 90%
And there you have it. Your customer retention rate for the quarter is a solid 90%. This means you successfully kept nine out of every ten customers you started with, which is a fantastic benchmark in most industries. If you want to see how your rate stacks up, you can discover key retention rate insights on Zendesk.com to compare against industry standards.
Applying the Calculation in Realistic Scenarios
Moving from the clean theory of a formula to messy, real-world data can feel a bit jarring. The principles are the same, but the context changes everything. To really get a handle on how to calculate customer retention rate, you need to see it in action in situations that corporate training businesses face every day.
So, let's walk through a few detailed scenarios. We'll look at a business with predictable annual contract renewals, a high-growth company juggling rapid client acquisition, and a firm with fluctuating client numbers from project-based work. Each example will give you a practical playbook for wrangling your own data accurately.
As you start applying the retention formula to different business models, having a solid process for tackling the math itself can make all the difference. For a great universal method, check out this guide on how to solve math problems step by step.
The Stable Subscription Model
Imagine your company provides annual compliance training subscriptions using Mindstamp's interactive video platform. Your renewal cycle is predictable, which makes this the most straightforward scenario to calculate.
Let's look at last year's numbers:
- Starting Clients (S): You began the year with 200 corporate clients.
- New Clients (N): You successfully signed 40 new companies.
- Ending Clients (E): You ended the year with 225 total clients.
Applying the formula [(E - N) / S] x 100:
[(225 - 40) / 200] x 100 = 92.5%
Your annual retention rate is a solid 92.5%. This is a strong indicator of client satisfaction with your training modules and points to a stable revenue base. For subscription businesses, running this calculation annually gives you a clear, strategic view of client loyalty.
The High-Growth Startup Scenario
Now, let’s picture a fast-growing training startup. You're bringing in new clients so quickly that it's easy to lose sight of whether you're keeping the ones you started with. This is exactly why isolating your original customer cohort is so critical.
Let's look at your first quarter:
- Starting Clients (S): You started Q1 with 50 clients.
- New Clients (N): The sales team had a killer quarter, adding 30 new clients.
- Ending Clients (E): You finished Q1 with 72 total clients.
Let's run the numbers:
[(72 - 30) / 50] x 100 = 84%
Your quarterly retention is 84%. While the business is growing like a weed, this metric quickly reveals that you lost 8 of your original 50 clients. That's a powerful insight. It tells you that while acquisition is on fire, you need to put more focus on improving the initial client experience. A seamless client journey is essential, and you can dig deeper by exploring customer onboarding best practices in our detailed guide.
Project-Based Training Contracts
Finally, let's tackle a trickier case: a company offering project-based training, like a six-month leadership development program. Here, client numbers can fluctuate, and a client might complete one project and then sign on for another later in the year.
A common pitfall is misclassifying a returning client as "new." To get an accurate retention number, a client who was with you at the start of the period and is still with you at the end—even on a new project—is retained, not new.
To avoid skewed data, establish a clear definition of an "active customer." A client should only be counted as new if they had no active project with you at the start of the measurement period.
Let's use a six-month timeframe for this one:
- Starting Clients (S): You began with 80 active projects.
- New Clients (N): You signed 15 genuinely new companies.
- Ending Clients (E): You ended the period with 75 active projects.
Here’s the math:
[(75 - 15) / 80] x 100 = 75%
Your retention rate here is 75%. For a project-based model, this is a healthy figure. It reflects your ability to deliver real value that encourages clients to come back for their next training initiative.
Choosing the Right Timeframe for Your Calculation
Once you've got a handle on how to calculate your customer retention rate, the next big question is when. Should you be running the numbers monthly? Quarterly? Annually?
There's no single right answer here. The best cadence really depends on your business model and the kind of corporate training contracts you work with. Picking the right timeframe is the key to getting meaningful data—choose one that's too short, and you might get a lot of noise. Wait too long, and you could miss critical warning signs from your clients.
The goal is to find that sweet spot that gives you a strategic, big-picture view while also delivering timely, actionable insights you can actually use.
The Strategic View of Annual Calculations
For most corporate training providers, especially those built on annual subscriptions, calculating retention yearly just makes sense. An annual calculation lines up perfectly with contract renewal cycles, giving you a stable, clear picture of client loyalty over the long haul.
This long-term perspective smooths out the small, month-to-month bumps—like a single client finishing up a short-term project—so you don't overreact to temporary dips.
Let's say you start January 1st with 1,000 customers. By December 31st, you have 1,200, and you know you brought in 400 new customers throughout the year. Your annual retention rate works out to be 80%. It’s also good to know where you stand; for instance, enterprise software companies often see retention rates of 95% or even higher. For a deeper dive, you can discover more about these customer retention metrics on Contentsquare.com.
Monthly and Quarterly Tracking as an Early Warning System
While annual reports are great for your strategic roadmap, monthly or quarterly tracking serves a completely different—and more immediate—purpose. Think of it as your early warning system.
These shorter check-ins are perfect for spotting dips in client engagement with your interactive video modules long before a renewal date is even on the radar.
For a platform like Mindstamp, if we see a client's video interaction rates suddenly drop off in a single month, that's a red flag. Catching this early means the customer success team can proactively reach out, offer some support, or schedule some extra training. It’s a tactical approach that lets you get ahead of problems and nurture at-risk clients, turning a potential churn situation into a retention success story.
The infographic below shows how different business models—from annual contracts to high-growth phases—can benefit from tailoring their measurement periods.
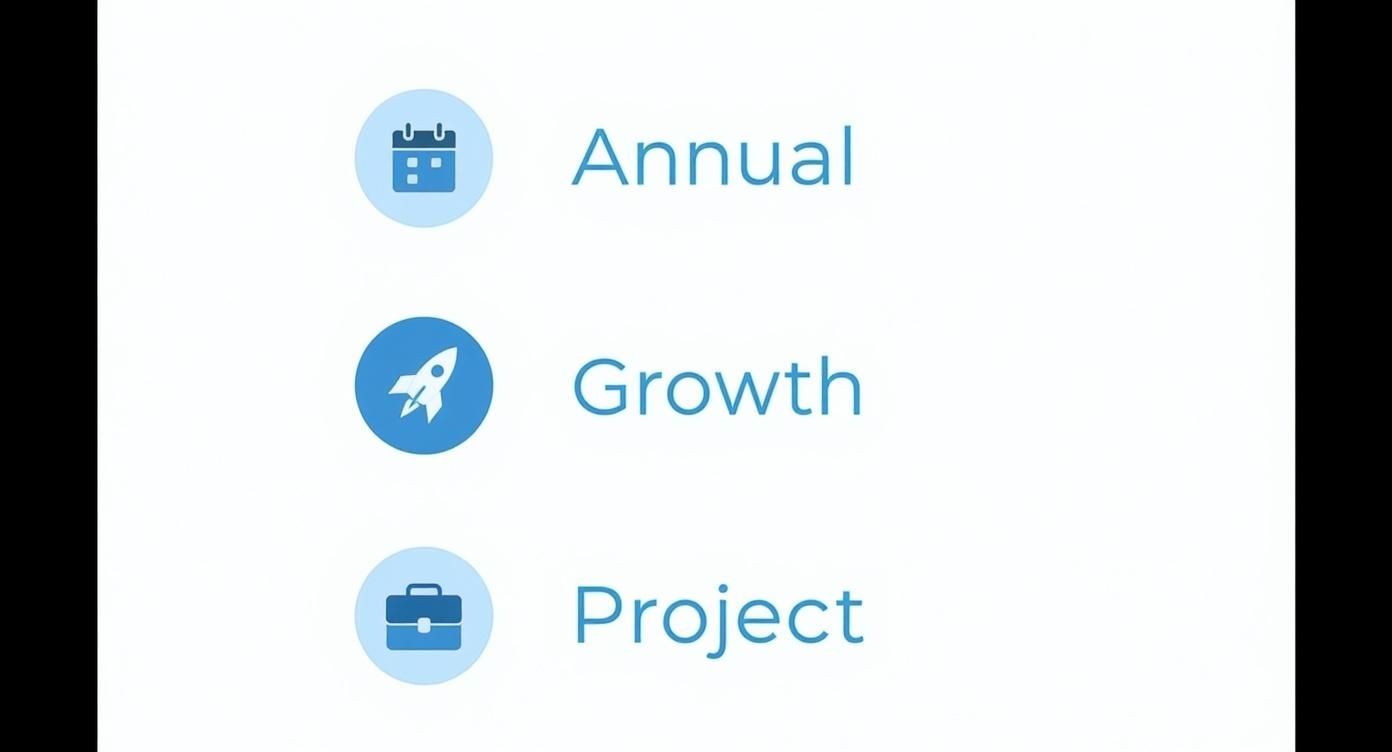
This visual guide really drives home the point: your ideal timeframe is the one that aligns with your specific client engagement patterns and contract cycles.
Choosing the right frequency transforms your retention calculation from a simple historical metric into a powerful, forward-looking tool for making smarter business decisions.
Comparing Retention Calculation Timeframes
So, how do you decide which timeframe is best for your corporate training clients? This table breaks down the common options to help you figure out what fits your needs.
Ultimately, many businesses find a hybrid approach works best. Use annual calculations for your high-level strategic planning and board meetings, but rely on monthly or quarterly check-ins to keep a pulse on client health and empower your customer success team to act fast.
Moving Beyond Customer Counts to Revenue Retention
Keeping your customers is obviously a good thing, but just knowing how to calculate customer retention rate gives you a dangerously incomplete picture.
Think about it. A high retention rate looks great on paper, but what if the customers you're losing are the ones paying you the most? A 90% retention rate can easily mask a massive revenue leak if the 10% walking out the door are your biggest enterprise accounts.
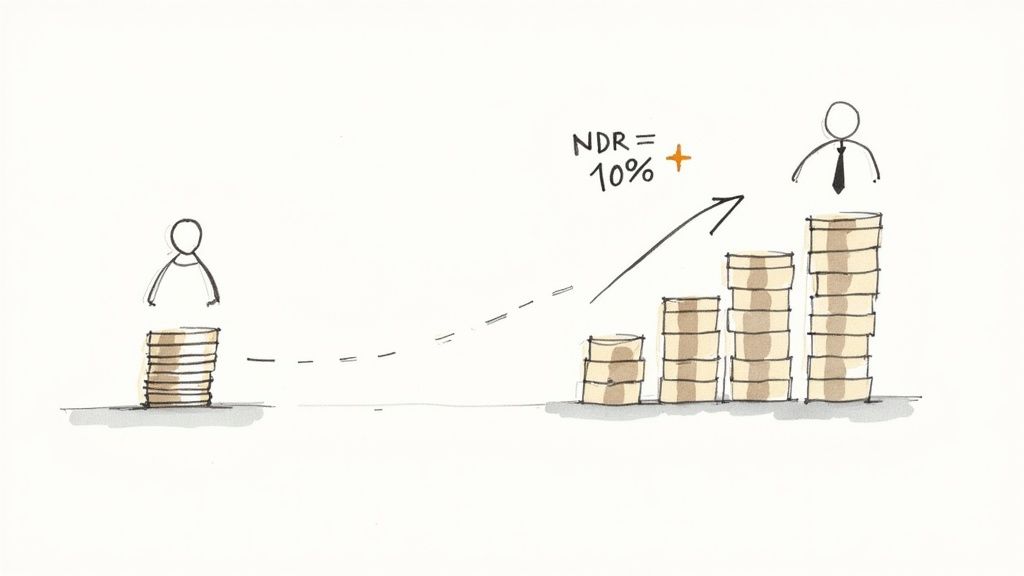
This is exactly why smart businesses look beyond simple customer counts and focus on a more powerful metric: Net Dollar Retention (NDR). It shifts the conversation from how many customers you keep to how much revenue you keep—and grow—from them.
What Is Net Dollar Retention?
Net Dollar Retention, or NDR, tracks the change in recurring revenue from your existing customers over a given time. It's a much more nuanced metric than standard retention because it factors in all the revenue movement within that customer group, including:
- Expansion: Happy customers who upgrade their plans or buy more from you. For example, a company adding 100 new licenses for your interactive training modules.
- Downgrades: Customers who reduce their spending, maybe by scaling back user seats after a project wraps up.
- Churn: The revenue you lose when a customer cancels their subscription altogether.
An NDR over 100% is the holy grail. It means your existing customers are spending more with you than you're losing from churn and downgrades. Your company is literally growing before you even sign a single new customer.
Calculating NDR for a Training Platform
Let's put this into practice with a real-world scenario. Imagine you run a corporate training business using a platform like Mindstamp to deliver interactive courses. You start the quarter with $50,000 in Monthly Recurring Revenue (MRR) from your existing client base.
During that quarter, a few things happen:
- You generate $10,000 in new MRR from current clients purchasing your new interactive compliance training modules (Expansion).
- One client downgrades their plan, reducing your MRR by $2,000 (Downgrade).
- Two smaller clients decide to leave, resulting in a loss of $3,000 in MRR (Churn).
Now, let's calculate the final MRR from that original group of customers:
$50,000 (Starting MRR) + $10,000 (Expansion) - $2,000 (Downgrade) - $3,000 (Churn) = $55,000
To get your NDR, you just divide the ending MRR by the starting MRR:
($55,000 / $50,000) x 100 = 110%
That 110% NDR is a fantastic signal. It shows that your customer base is not just sticking around but is actively growing in value—a testament to your product's effectiveness. This is the kind of metric that directly ties your retention efforts to financial health, making it much easier to prove the ROI on training investments you provide.
The connection between retention and real revenue growth is why NDR is so closely watched. Top-tier SaaS companies like Datadog and Salesforce have reported NDRs well over 120%, showing just how much growth potential is locked inside an existing customer base.
Answering Your Trickiest Retention Questions
Even when you have the formulas down cold, real-world situations can throw a wrench in the works. Let's tackle some of the most common questions that pop up when corporate training providers start digging into their customer retention rate.
What’s a Good Retention Rate for Corporate Training?
Everyone wants a benchmark, and that's fair. For most B2B subscription services, including corporate training platforms, a solid annual customer retention rate is around 85% or higher. If you're serving enterprise-level clients, the bar gets even higher—you should be aiming for 95% or more.
But here's the thing: a "good" number really depends on your business.
Are you offering short-term, project-based training? Your rate will naturally look different than a company that provides essential, year-round compliance training. The real goal isn't just to hit some industry number; it's to track your own rate over time and focus on pushing it upwards.
How Do I Handle a Customer Who Churned and Then Came Back?
Ah, the boomerang customer. This one trips people up all the time.
For the standard retention formula, the cleanest approach is to not count them as a 'New Customer Acquired' (N) for that period.
Think about it: they were already part of your customer base at the start of the period ('Starting Customers' or S). By leaving them out of the 'new' bucket, the formula works as intended and correctly counts them as a retained customer, since they were there at the beginning and the end. It’s a simple rule that keeps you from muddying the waters and deflating your true retention rate.
Quick sanity check: If your customer retention rate calculation ever goes over 100%, something's wrong. You've almost certainly miscounted your new customers or messed up your start and end dates. Time to double-check the data.
How Can Interactive Video Improve My Retention Rate?
This is where things get interesting. Interactive video is a game-changer for engagement, and engagement is the fuel for retention.
When you use a platform like Mindstamp to embed questions, branching paths, and clickable hotspots into your training, you're transforming a passive watch-party into an active learning experience.
This isn't just about bells and whistles. It drives up course completion rates and, more importantly, knowledge retention. When your clients see their own teams are actually learning and applying the material effectively, the value of your service becomes undeniable. They're far more likely to renew, directly boosting your customer retention rate because you’ve proven you’re indispensable.
Ready to turn passive training videos into retention-boosting experiences? With Mindstamp, you can easily add interactive elements that prove your value and keep clients coming back. Discover how Mindstamp can transform your training content.
Get Started Now
Mindstamp is easy to use, incredibly capable, and supported by an amazing team. Join us!


Try Mindstamp Free


