

What Is Video Analytics for Corporate Training and Development


Let’s cut right to it. Video analytics is the process of collecting and analyzing data on how learners interact with training videos. The goal is simple: to understand their engagement, comprehension, and how effective the training actually is. This goes way beyond a simple "view count" by telling the real story behind how your team learns. By using an interactive video platform such as Mindstamp, corporate L&D teams can easily create engaging, interactive learning and training content and leverage deep analytics to optimize every module.
What Is Video Analytics in Corporate Training

Imagine you just rolled out a critical new safety protocol video for your latest group of hires. In the old days, you might just track who clicked "play." But you have no clue if they actually understood it, paid attention, or just let it run in the background while they grabbed a coffee. For any serious Learning and Development (L&D) department, relying on those basic metrics is a huge liability.
This is where video analytics comes in. Think of it like a smart coach watching over your team's training session. Instead of just ticking a box that a video was "viewed," this coach gives you a detailed report on learner behavior. It tells you exactly which concepts made people scratch their heads, which parts they rewatched for clarity, and where their attention started to drift. Suddenly, passive viewing becomes an active, measurable learning experience.
Beyond the Play Button
Getting this deeper level of insight is what separates mediocre training from truly effective corporate learning. It’s all about swapping out assumptions for hard, evidence-based decisions. With the right tools, you can finally answer the tough L&D questions that video alone could never solve:
- Comprehension: Did the sales team really grasp the key features of the new product, or did they just sit through the launch video?
- Engagement: Which parts of our onboarding series are genuinely connecting with new hires, and where are we losing them?
- Effectiveness: Is our compliance training actually working? Can we prove it with real data?
This is precisely what platforms like Mindstamp are built for. By embedding questions, clickable hotspots, and other interactive elements directly into the video, the data you collect becomes far more meaningful than just view duration. You’re not just tracking eyeballs on a screen; you’re measuring active participation and knowledge retention. It's a key part of a much larger trend where companies are digging into the specifics of user interactions. If you want to go deeper on this, check out our guide on what is behavioral analytics.
Video analytics shifts the entire conversation from, "Did they watch it?" to, "Did they learn from it?" It gives you the concrete data you need to measure training ROI and make your content better every single time.
From Basic Views to Deep Learning Insights
To really see the difference, let’s look at how the metrics have evolved. What you get from a public platform like YouTube is worlds away from the rich data you can pull from a dedicated training platform.
This table really highlights the jump from passive consumption metrics to active learning intelligence. You move from guessing to knowing.
The entire industry is making this leap. There's been a clear industry transition from clunky on-premises hardware to more flexible and powerful cloud-based software. According to Grand View Research, software-based solutions now command a huge share of the market. This shift has put incredibly powerful tools into the hands of L&D pros, finally allowing them to connect their training efforts to real, tangible business outcomes.
Unpacking Key Training Video Metrics
If you really want to get what video analytics is all about, you have to look past the surface-level numbers. Just knowing someone watched a video doesn’t tell you much. The real story is in how they watched it. That’s where a detailed look at engagement and comprehension data becomes a game-changer for any Learning and Development (L&D) pro.
Think of these metrics as a diagnostic tool for your training content. They’re what let you pinpoint the moments that grab your learners, flag the parts that are causing confusion, and get solid proof that knowledge is actually sinking in.
This diagram gives you a simple look at how raw video data gets captured, crunched, and turned into something you can actually act on.
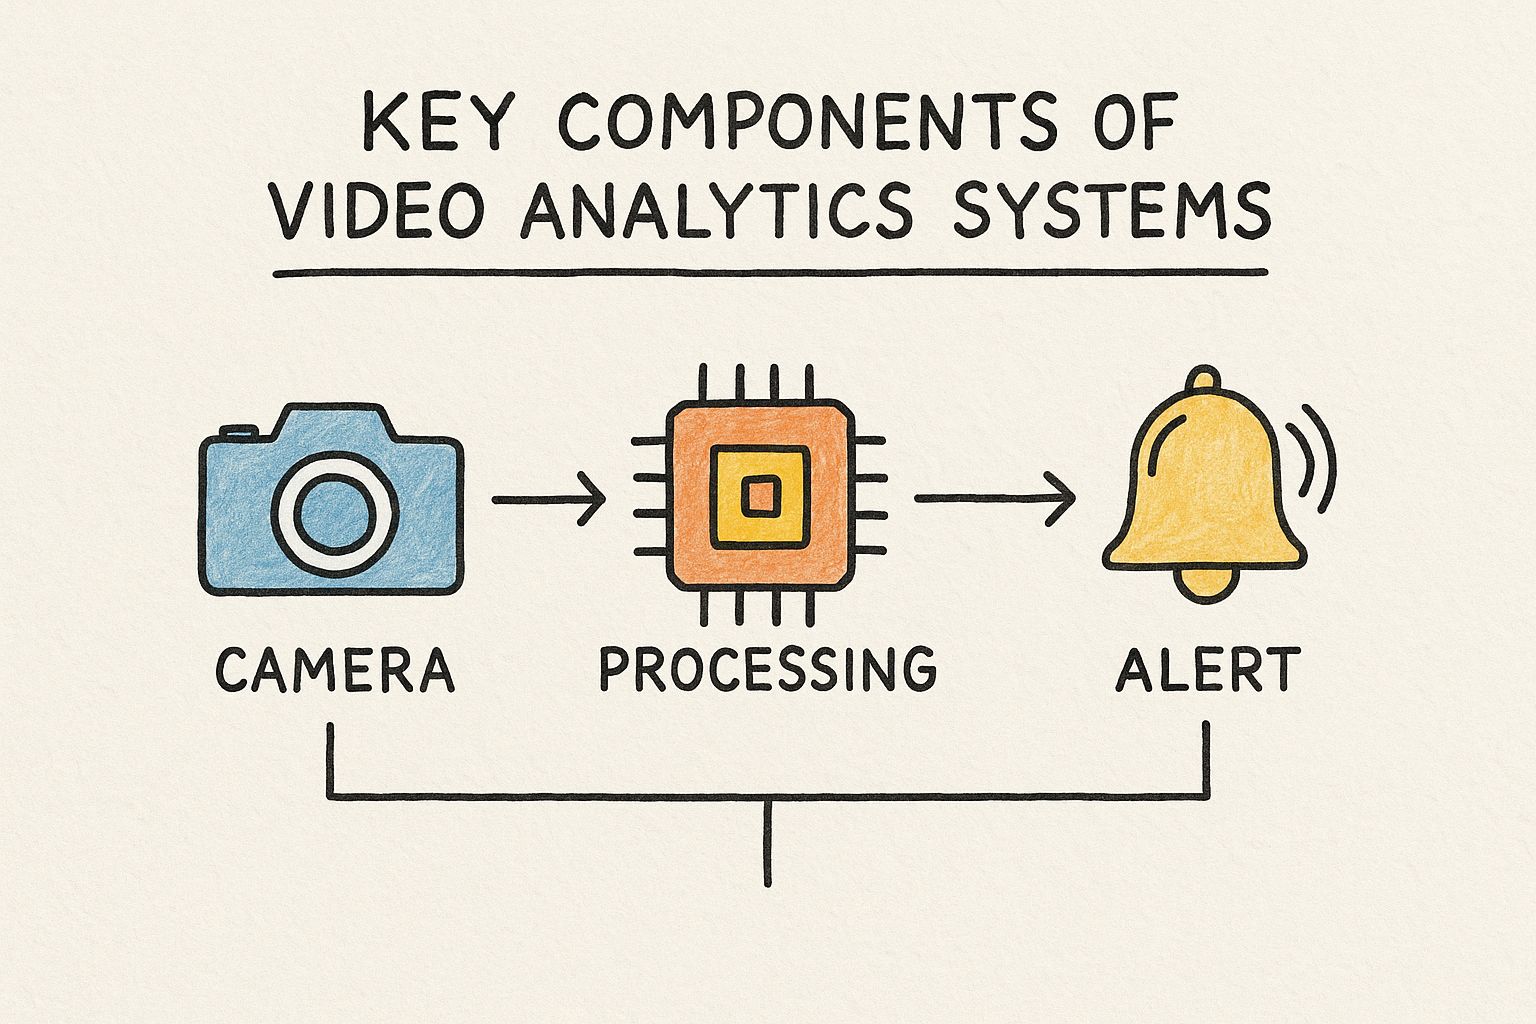
It breaks down how visual information becomes a trigger for action—which, at the end of the day, is the whole point of using analytics in a training setting.
Measuring Learner Engagement
Engagement metrics are your window into how captivating your content really is. Low engagement is a direct signal that your training is missing the mark. High engagement, on the other hand, shows you what’s working so you can do more of it.
- Completion Rate: This is the most basic, yet essential, engagement metric. It’s simply the percentage of people who watched your video all the way through. If you have a mandatory compliance video with a dismal completion rate, that’s a major red flag you need to jump on immediately.
- Rewatch Heatmaps: Imagine a visual overlay on your video's timeline that glows brighter where people rewatched the most. That’s a heatmap. It’s a dead giveaway for which concepts were tricky enough to need a second pass, helping you spot topics that might need a clearer explanation.
- Play Rate: This one’s straightforward—it’s the percentage of people who clicked "play" after the video loaded. A low play rate can mean your title, thumbnail, or intro just isn't compelling enough to get learners to even start.
These data points are gold for refining your content. To go even deeper, check out our detailed guide on key video engagement metrics.
By analyzing engagement, you stop assuming your content is interesting and start knowing precisely which parts are holding your audience’s attention—and which parts are causing them to bail.
Proving Learner Comprehension
Engagement is great, but comprehension is the real prize. It's the whole reason you're creating training in the first place. This is where interactive video platforms like Mindstamp come in, giving you data that a standard video player could only dream of. By embedding questions right into the video, you can directly measure what people are actually learning.
- Question Responses: There's no more direct way to measure knowledge retention than by tracking answers to in-video questions. For instance, if 75% of your sales team gets a specific product question wrong, you've just uncovered a critical training gap that needs immediate attention.
- Interaction Data: This covers every click on buttons, hotspots, or links you've placed in the video. If you add a link to a downloadable safety checklist and see tons of clicks, that’s hard evidence that your team is actively using the resources you provide. This data turns passive watching into an active, measurable learning experience, giving you clear proof of both comprehension and participation.
Why Video Analytics Is Your L&D Superpower

Understanding key metrics is one thing, but connecting that data to real business outcomes is where video analytics really starts to shine. It’s what elevates your training programs from a "nice-to-have" expense to an essential tool that drives measurable results.
Simply put, this is the difference between hoping your training works and proving it does.
For any Learning and Development (L&D) department, the core mission is to build a more skilled, efficient, and safer workforce. Video analytics hands you the hard data you need to make that happen, giving you a clear line of sight into how every single piece of training content is performing.
Diagnose and Solve Skill Gaps Fast
Imagine you've just rolled out a critical new safety protocol video. A few weeks later, you notice the new procedure still isn't being followed correctly on the factory floor. Without analytics, you're stuck guessing. Was the video too long? Was a key explanation unclear? That kind of guesswork isn't just inefficient—it can be downright dangerous.
This is where the power of analytics becomes crystal clear. One company faced this exact problem and dug into their video data. What did they find? A massive viewer drop-off and a huge spike in rewatches right at the 37-second mark, the precise moment where a new multi-step process was explained. The data pinpointed the exact moment of confusion.
Armed with this insight, the L&D team didn't need to scrap the entire training video. Instead, they created a short, targeted micro-learning clip that broke down that one complex step. They pushed it out to the team, and within a week, compliance shot up, leading to a measurable reduction in workplace incidents.
Video analytics allows you to move from broad assumptions to surgical precision. You can spot skill gaps before they turn into performance issues and deliver targeted solutions that fix the actual problem.
Personalize Learning and Prove Your ROI
This data-driven approach goes way beyond just fixing problems. It gives you the foundation to build a more effective learning culture from the ground up. When you understand how individuals and teams engage with content, you can start creating personalized learning paths that cater to different needs and skill levels.
- Measure True ROI: Finally, you can connect training completion and comprehension scores directly to business KPIs. Imagine showing stakeholders that the sales reps who scored above 90% on the new product training also saw a 15% lift in their sales numbers. That's powerful.
- Personalize at Scale: You can automatically identify learners who are getting stuck on specific concepts and recommend supplemental materials. This ensures everyone gets the support they need to succeed, all without requiring a trainer to manually intervene.
- Optimize Your Content: Use engagement data to figure out which video formats, lengths, and interactive elements actually resonate with your audience. This helps you invest your content budget where it will have the biggest impact.
Ultimately, video analytics is much more than a reporting tool; it's a strategic business tool. It gives L&D pros the evidence they need to not only improve learning outcomes but also to prove their direct contribution to the company's success.
How AI Is Shaping the Future of Learning Analytics
The core metrics we've covered are a fantastic starting point for understanding how people learn with video. But the real game-changer? It’s Artificial Intelligence (AI).
AI takes all that raw viewing data and turns it into something much more powerful: predictive insights. It automates the kind of complex analysis that used to require a team of data scientists, making deep, actionable intelligence accessible to any Learning and Development (L&D) department, no matter its size.
For corporate training, this is a massive leap forward. Instead of just looking back at what happened, L&D leaders can finally get proactive. AI algorithms can sift through thousands of data points—like a slight hesitation on a quiz question, rewatching a specific segment multiple times, or unique interaction patterns—to spot trends a human would almost certainly miss.
From Reactive Reporting to Predictive Insights
Think of it this way: traditional analytics tells you what happened. AI-powered analytics tells you what’s likely to happen next. This shift from historical reporting to predictive modeling is what makes AI so powerful. It moves L&D from a reactive role into a truly strategic one.
- Spotting At-Risk Learners: AI can flag employees who are struggling with training material in real-time. By analyzing engagement patterns, it can predict who is unlikely to complete a certification or master a key skill, giving you a chance to step in and help before they fall behind.
- Predicting Future Performance: Based on how a learner interacts with training content, AI can start to forecast their future performance on the job. This helps managers provide targeted coaching right where it's needed most.
- Automating Content Recommendations: AI can also act like a smart tutor. If an employee struggles with a tricky section of a compliance video, the system can automatically serve them a quick micro-learning module to clarify that exact topic.
This kind of automation frees up L&D leaders to make data-driven decisions that build a more skilled and agile workforce, all without getting bogged down in manual data crunching.
With AI, video analytics is no longer just about measuring engagement. It's about actively shaping learning outcomes and anticipating your team's needs before they ever become critical issues.
The Growing Impact of AI on Video Analytics
This isn't just a niche trend; it's driving the entire industry forward. The AI-powered side of the video analytics market is easily the most dynamic and fastest-growing area.
In fact, the market is projected to grow at an incredible CAGR of 32.5%, hitting a market size of USD 241.8 billion by 2033. This explosive growth shows just how central AI has become to automating analysis and helping businesses make smarter, faster decisions. You can dig into more of these industry trends in this detailed market analysis.
For platforms like Mindstamp, this means our focus is on building tools that don't just show you data, but give you predictive insights and automated reports. The goal is simple: to give L&D professionals a clear, forward-looking view of their training programs' effectiveness, connecting what happens in training directly to business success.
All the theory is great, but putting your video analytics into practice is where the magic really happens. With an interactive video platform like Mindstamp, which allows customers to create engaging, interactive learning and training content, you can quickly turn that raw data into a clear roadmap for improving your training programs.
It all starts by making your training videos truly interactive. Think of embedding elements like questions, clickable hotspots, or even branching scenarios directly into the video timeline. Every single time a learner engages with one of these, it becomes a data point. You’re effectively transforming a passive viewing session into a treasure trove of actionable insights that answer your most pressing L&D questions.
Answering Your Most Critical Training Questions
Once your interactive video is out in the wild, the real work begins inside your analytics dashboard. This is where you connect the dots between data and actual outcomes. No more guessing—now you can walk into a stakeholder meeting with definitive, data-backed answers. The best platforms will serve up this information in a way that’s actually easy to understand.
For L&D pros, this means you can finally tackle those fundamental questions with total confidence:
- Compliance Tracking: Who actually completed the mandatory annual security training? You can pull up a list of named viewers and see their exact completion status in seconds.
- Knowledge Gaps: Which sales reps really understood the new product features? By digging into quiz responses, you might find that while 95% of the team passed, a specific group consistently struggled with questions about competitive positioning.
- Onboarding Hurdles: Where are new hires getting stuck in the onboarding process? Engagement heatmaps could reveal that a particular segment of the "Company Culture" video is being rewatched over and over, signaling clear confusion.
This level of detail lets you move past simple completion rates and truly diagnose how effective your content is. If you want a closer look at how these dashboards are laid out, you can explore a detailed guide on how to view interactive video data and reports that walks through the specific features.
Video analytics allows you to stop reporting on activity and start demonstrating real impact. It’s the hard evidence you need to prove that learning is happening and that your training programs are delivering tangible value.
Turning Insights into Actionable Steps
At the end of the day, the goal of digging into all this data is to make smart decisions that improve learning. The insights you uncover should lead directly to real, tangible improvements in your training strategy.
For example, that confusing section in the onboarding video? Your next step is crystal clear. You can create a short, targeted micro-learning video that dives deeper into that specific concept and assign it to the next cohort of new hires.
This kind of proactive, data-driven approach is worlds more effective than just waiting for performance issues to pop up months down the line. It empowers you to refine, iterate, and constantly improve the quality of your training, ensuring every video hits its mark.
Here’s a practical way to think about connecting your questions to the right data points:
Answering Your Key Training Questions with Analytics
It can be tough to know where to start. This table breaks down common training questions and matches them with the specific Mindstamp metric that holds the answer, helping you see exactly how data translates into strategy.
By using a framework like this, you're no longer just collecting data for the sake of it. You’re actively using it to get smarter about how you train, support, and develop your people.
Common Questions About Training Video Analytics
Anytime you bring in a new tool, questions are bound to pop up. That’s especially true with something like video analytics. For folks in Learning and Development (L&D), the real challenge is cutting through the tech-speak to see how this stuff actually solves the problems you face every single day.
So, let's clear the air and tackle some of the most common questions head-on. The goal here is to move past any uncertainty and show you how data can make your training programs stronger, more effective, and a whole lot easier to justify to the higher-ups.
How Is This Different from YouTube Analytics?
This is a big one, and the distinction is critical. Think of it this way: YouTube analytics are built for creators. Their world revolves around audience growth and making money. They’re tracking broad metrics like total views, watch time, and subscriber counts to figure out if a video is popular.
Training video analytics, on the other hand, are built for L&D. They’re designed to answer a completely different set of questions. They track things like an individual learner's comprehension, completion rates for compliance training, and every single interaction with learning elements like embedded questions or resource links.
It's the difference between knowing if a video was watched versus knowing if it actually taught someone what they needed to know.
Training analytics answer the question, “Did they learn it?” Platform analytics just answer, “Did they watch it?” For corporate L&D, only the first question really moves the needle.
Do I Need a Data Science Degree to Use This?
Not a chance. Modern interactive video platforms like Mindstamp are built for training professionals and educators, not data analysts. The dashboards are designed to be completely intuitive. You get clear, visual reports that give you insights without ever making you feel like you're drowning in raw numbers.
You can see in an instant who has finished a required module, how they answered key questions, and exactly where they might have gotten stuck. It's all laid out in simple charts and reports. You’ll never have to touch a complex spreadsheet or write a line of code. The whole system is designed to deliver actionable insights, not data overload.
How Can Analytics Help Me Prove Training ROI?
This is where video analytics really shines. Analytics give you the hard data you need to draw a straight line from your training efforts to real business outcomes. Instead of just telling stakeholders that training was "completed," you can show them that it was effective.
Imagine being able to walk into a meeting and show that 98% of the sales team passed the final assessment on the new product features. When you can connect concrete learning metrics like that to improvements in business KPIs—like a jump in sales, better customer satisfaction scores, or fewer safety incidents—you suddenly have a powerful, data-backed case for your training program's return on investment (ROI).
What About Learner Privacy and Data Security?
Learner privacy isn’t just an afterthought; it's a top priority in any corporate environment. Unlike a public video platform, a dedicated training system like Mindstamp operates within a secure, closed-off ecosystem.
Access is locked down to authorized employees only, and all the data collected from learners is managed according to your company's strict security and privacy policies. The analytics are used for one purpose and one purpose only: to improve learning outcomes and make the overall program better. It's not for public surveillance or performance tracking outside of the L&D context.
Ready to see for yourself what video analytics can reveal about your training content? Mindstamp makes it incredibly simple to add interactions and uncover deep insights into how your learners are engaging and what they're truly understanding. It's time to turn your passive videos into active, data-driven learning experiences.
Get Started Now
Mindstamp is easy to use, incredibly capable, and supported by an amazing team. Join us!


Try Mindstamp Free


