 Brett Lindenberg
Behavioral analytics is the practice of collecting records of what people do in a website, app, product, or system (page views, clicks, sign-ups, purchases, logins, answers) and analyzing those records to find patterns that explain or predict an outcome. It works from actions rather than from what people say in a survey or who they are on paper. Product and marketing teams use it to see where users drop out of a sign-up or checkout and which early actions go with users who stay. In security, a form called user and entity behavior analytics (UEBA) flags activity that departs from an account's normal pattern. In training, it shows where learners struggle inside a course. Behavioral data shows what happened and when; to learn why, you still need a question, an interview, or a test. The short demo below gives you one learner's event sequence and asks what it supports.
What is behavioral data?
Behavioral data is a record of an action. Each record, usually called an event, holds four things: who acted (a user ID, or a device ID for an anonymous visitor), what they did (the event name), when (a timestamp), and the context (page, device, plan, video timecode, or any other property you choose to record).
| Setting | Typical events |
|---|---|
| Website | Page views, scroll depth, link and button clicks, form submissions |
| Software product or app | Sign-up, feature used, teammate invited, plan upgraded, account canceled |
| Online store | Product viewed, added to cart, checkout started, purchase, return |
| IT and security | Sign-in time and location, device, files downloaded, permissions changed |
| Training and video | Lesson started, video progress, answer given, path chosen, course completed |
Two other kinds of data sit next to it. Descriptive data says who someone is: role, company size, location. Attitudinal data says what they think: survey answers, ratings, interview notes. Behavioral data records what people did and says little about why. Good analysis combines all three.
Behavioral analytics methods
Most behavioral analysis uses a handful of methods. Each one answers a different question.
| Method | Question it answers | Example |
|---|---|---|
| Funnel analysis | Where do people drop out of a sequence of steps? | Of visitors who start a sign-up form, the share who finish each step |
| Cohort and retention analysis | Do groups that started at the same time, or did the same thing, come back at different rates? | Users who imported data in their first week compared with users who did not |
| Path analysis | Which routes do people take before or after an event? | The pages people view before they request a demo |
| Segmentation | How does behavior differ between groups? | Mobile and desktop users, or new and returning customers |
| Anomaly detection | Is this activity unusual for this user or device? | A sign-in from a new country followed by a large file download |
| Experiments (A/B tests) | Does a change cause a difference? | Two onboarding flows compared on the same activation event |
Only the experiment shows cause. The other methods show which behaviors go together, which is often enough to decide where to look next but not enough to prove that one action produces another. If users who import data in week one stay longer, test it: prompt half of new users to import and compare the two groups.
You do not need a specialist tool to start. Google Analytics 4 Explorations include funnel exploration, path exploration, cohort exploration, segment overlap, and user lifetime techniques at no cost.
How to build a behavioral analytics strategy
A behavioral analytics strategy is a short plan that links one business question to the events you track and the action you will take. Start from the question and add only the events that answer it.
- Write the question as a decision. For example: "Should we change the second step of onboarding?" or "Which compliance module needs rework?"
- List the events that can answer it, with a name, a description of when it fires, and the properties it carries. This list is your tracking plan. Keep names consistent, such as object then action: "Lesson Started", "Question Answered".
- Decide how you identify people. Anonymous visitors get a device or browser ID. Known users need a stable ID, such as an account ID or email, or one person shows up as several.
- Check the data before you trust it. Trigger each event yourself and confirm it arrives once, with the right properties.
- Set a baseline, make one change, and compare the same measure afterward.
Write down what you will not track as well. A shorter list is easier to keep accurate and easier to explain in a privacy review.
Behavioral analytics examples
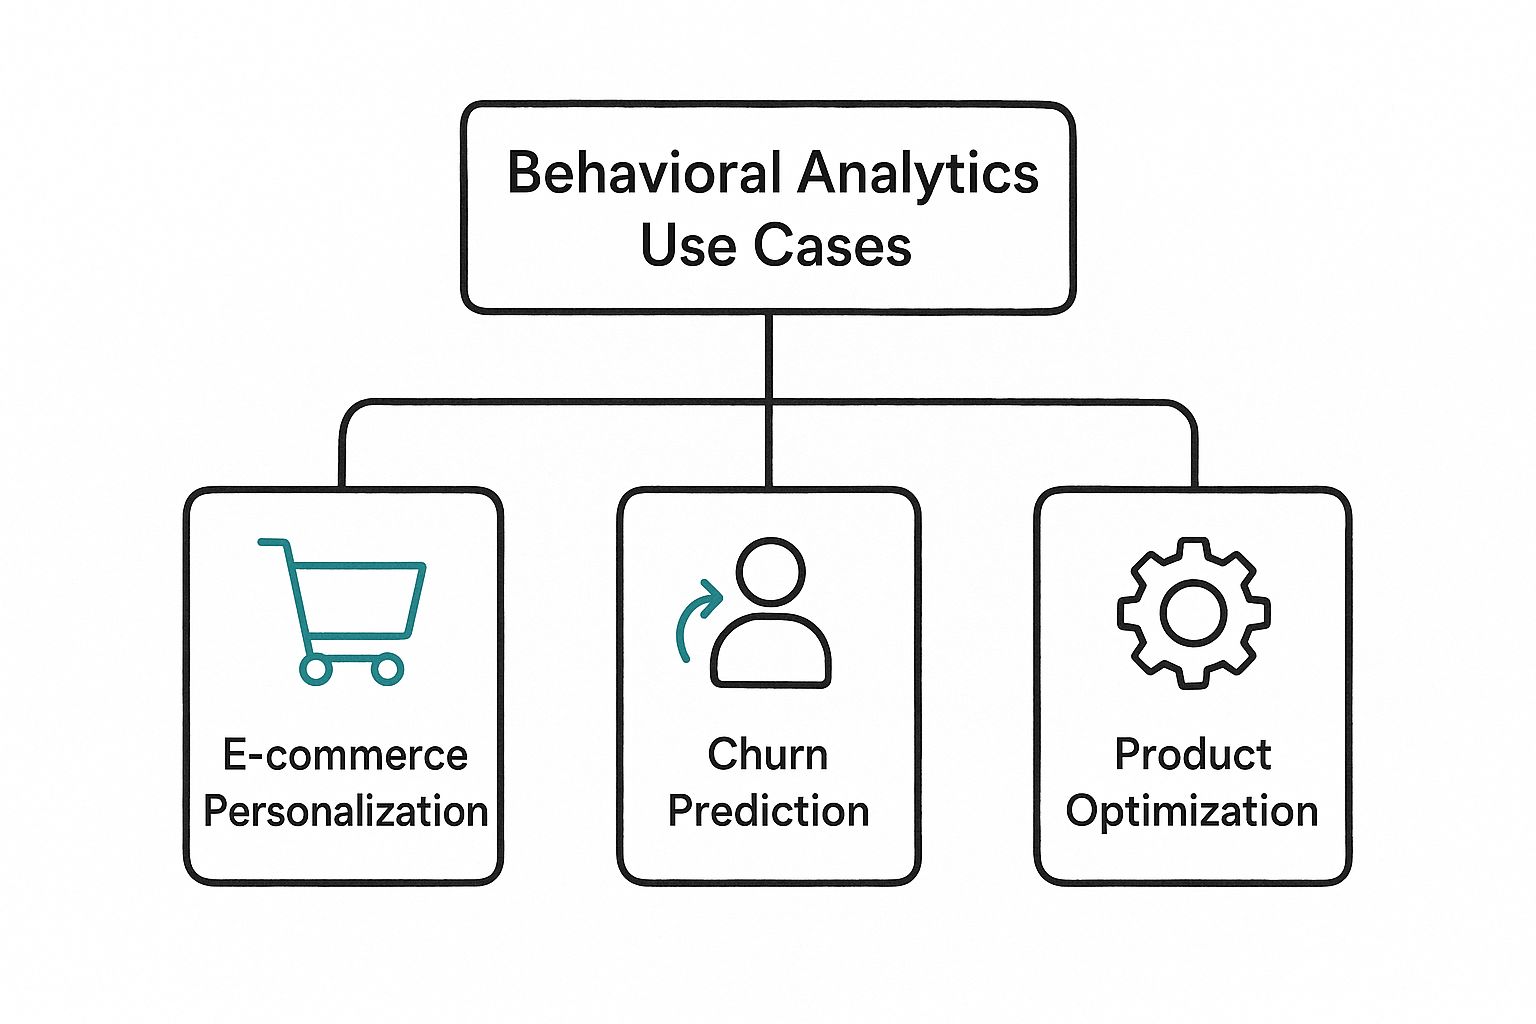
Software products: activation and retention
A software team defines an activation event, the first action that tends to go with users who stay, such as creating a first project or inviting a teammate. A funnel shows how many new users reach it and where the rest stop. A retention chart compares users who reached it in week one with users who did not. The team then changes onboarding to move more people to that action and checks whether retention moves with it.
Marketing and online stores: funnels and friction
A store tracks product views, add-to-cart, checkout steps, and purchases. If many shoppers stop at the shipping step, session recordings of that step often show the reason, such as a surprise fee or a broken field on mobile. Click heatmaps show where people try to click, and scroll heatmaps show how far down a page they get. Microsoft Clarity offers both session recordings and heatmaps at no cost (checked October 2026).
Security and compliance: user and entity behavior analytics
In security, behavioral analytics builds a baseline of normal activity for each account and device and flags departures from it. Microsoft describes its Sentinel UEBA as building behavioral profiles for users, hosts, IP addresses, applications, and other entities, then comparing current activity with those baselines to find threats such as compromised accounts, insider attacks, and lateral movement. It scores anomalies so analysts can decide which to investigate first.
Compliance teams use a related approach for insider risk. Microsoft Purview Insider Risk Management correlates signals to find risks such as data leaks, intellectual property theft, and security policy violations, and it pseudonymizes users by default. When a person breaks a policy by accident, a reviewer can send a reminder that points to refresher training.
Training and development: what learners do inside a course
Course completion tells you who finished. Behavioral data from inside the course shows how they got there. In an interactive training video, the useful events are:
- Watch progress: the share of the video each learner played, the furthest point they reached, and where they stopped
- Answers to each question, with the time in the video and whether the answer was correct
- Clicks on buttons and hotspots, such as opening a policy document
- The branch each learner chose in a scenario
- Drop-off across the whole audience, which shows the section where many learners stop
Mindstamp reporting records these per learner and per view, and drop-off by section is available on supported plans. Learners stay anonymous until you identify them with lead capture, a personalized link, or URL parameters; our help article on viewer identity explains the options.
The demo above shows how to read one sequence. A learner who replays an explanation and then misses the question tied to it has shown effort, and the miss points to a problem with the explanation, the question, or a real gap in knowledge. Before you act, check whether the explanation contains what the question asks and whether other learners missed the same question. If most of them did, fix the content. If one learner did, offer that learner a focused review. Our training trigger rule example lets you choose which event should open that review.
Questions pause the video, so each in-video question records an answer at a known point in the lesson, and you can compare it with the section just before it. For a full measurement plan, see how to measure training effectiveness, and for the reports a video platform should provide, see what video analytics is.
Employee behavior analytics and privacy
"Employee behavior analytics" covers two different jobs. Security and compliance teams use it to spot risky activity, as in the UEBA and insider risk tools above. HR and learning teams use it to understand how people use tools and training. Both process personal data about workers, so both need care.
In the UK, the Information Commissioner's Office guidance on monitoring workers says employers must make sure workers are aware of how and what personal information is collected, must identify a lawful basis, must check that the monitoring is necessary and that no less intrusive way would achieve the purpose, and must carry out a data protection impact assessment before processing likely to cause high risk. The ICO notes that this guidance is under review after the Data (Use and Access) Act. Rules differ by country, so check with your privacy team before you start.
A few practices keep training analytics on the right side of that line:
- Start with aggregate data. If many learners miss the same question, fix the question or the lesson before you look at any one person.
- Use individual data to offer help, such as a review or a coaching conversation, and say so in your training policy.
- Tell employees what the training platform records and who can see it.
- Keep training data separate from performance ratings unless the assessment measures a skill the job requires.
For questions about teams, such as which teams finish onboarding faster or which ones struggle with a module, aggregate reports answer most of them without singling anyone out.
Behavioral analytics tools
Pick the tool by the behavior you need to see. The free tiers below were checked on each vendor's site in October 2026.
| Category | Examples | What you get |
|---|---|---|
| Web analytics | Google Analytics 4 | Free. Funnel, path, and cohort explorations on website and app events. |
| Product analytics | Mixpanel, Amplitude | Event-based product analytics. Mixpanel's free plan includes funnels and retention on up to 1 million events a month. Amplitude's free plan includes product analytics on 2 million events a month. |
| Session recording and heatmaps | Microsoft Clarity | Free recordings of individual sessions and click and scroll heatmaps. |
| Security and insider risk | Microsoft Sentinel UEBA, Microsoft Purview Insider Risk Management | Behavior baselines, anomaly scores, and insider risk policies. Sentinel includes UEBA at no extra cost, with standard Sentinel data pricing. |
| Training and interactive video | Mindstamp | Per-learner answers, clicks, paths, watch progress, and completion inside the video, with CSV export and SCORM packages for an LMS. |
Common questions
What is behavioral data analysis?
Behavioral data analysis is the work of turning event records into answers: cleaning the events, grouping them by user or session, and applying a method such as a funnel, a cohort comparison, or a path report. The output should be a decision, such as which step to fix or which group to contact.
How is behavioral analytics different from web analytics?
Web analytics reports traffic in aggregate: sessions, sources, pages, and conversions. Behavioral analytics follows the sequence of actions for each user or group of users over time. The line has blurred, because GA4 records events and offers path and cohort analysis, but dedicated product analytics tools go deeper on user-level sequences.
Can behavioral analytics tell you why people act?
It can narrow the possible reasons, and it cannot confirm one. A learner who replays a section might be confused, careful, or interrupted. To find out, ask: add a short question at that point in the video, run a survey, or test a change and measure the result.
Is it behavioral analytics or behavioural analytics?
Both are correct. "Behavioral" is the American spelling and "behavioural" is the British spelling. "Behavior analytics" means the same thing.
How does behavioral analytics relate to data-driven content and decisions?
Behavioral analytics supplies evidence, and data-driven content and decision making are about what you do with it. Our guide to data-driven content marketing shows how to turn audience behavior into content briefs, and our guide to data-driven decision making covers the decision side. For engagement metrics in software products, see user engagement metrics.
To start, pick one decision you need to make this quarter, list the five to ten events that would inform it, and confirm each one is recorded correctly. Then set a baseline before you change anything.