

What is Data Driven Decision Making in Corporate Training?


Data-driven decision making is the process of using facts, metrics, and hard data to guide strategic choices for corporate training and development. Instead of relying on intuition or anecdotal feedback, you let evidence lead the way to create more effective learning programs.
For Learning and Development (L&D) professionals, this means building training that you know will work because the data says so, proving its value to the entire organization.
Moving Beyond Guesswork in Corporate Training
For years, many Learning and Development (L&D) departments have relied on "happy sheets" to gauge success. You know the ones—those simple surveys asking employees if they enjoyed the training. While the intention is good, it’s a bit like a chef asking diners if they liked the music but never asking how the food tasted. It measures feelings, not actual impact on skills or performance.
This is where a data-driven mindset completely changes the game. It’s the critical shift from hoping your training is effective to knowing it is. You stop relying on assumptions and start using real evidence to build, tweak, and prove the value of your learning initiatives.
And this isn't just an L&D trend; it’s a fundamental shift in how modern businesses operate. A recent study found that 73.5% of executives at top companies consider their decision-making to be consistently data-driven, and over 40% of organizations worldwide are now using big data analytics. The movement is here, and it's reshaping corporate education.
From Anecdotes to Actionable Insights
Let's paint a picture. Imagine a training manager, Sarah, rolls out a brand-new sales training video. The anecdotal feedback is positive; a few salespeople mention they "liked it." This is the classic, intuition-based approach.
But a data-driven Sarah digs deeper. Using an interactive video platform like Mindstamp, she pulls up the analytics and uncovers a few things:
- Engagement Metrics: A huge number of viewers drop off at the 3-minute mark, right before the most critical segment on closing techniques.
- Quiz Scores: 60% of the team answered questions about a new product feature incorrectly. That’s a massive knowledge gap.
- Performance Data: Sales reports after the training show zero increase in sales for that specific new feature.
This is the heart of data-driven decision making. Sarah now has specific, actionable insights. She isn't guessing what’s wrong; she knows exactly where the training is falling short. Her next steps are clear: shorten the video, re-record that confusing segment, and schedule a follow-up workshop focused squarely on the product feature.
To really see the difference, let’s compare the two approaches side-by-side.
Intuition-Based vs Data-Driven Training Decisions
This table highlights the fundamental shift from a traditional, reactive training model to a strategic, data-informed one.
The move to a data-driven model empowers L&D to become a strategic partner that directly influences business outcomes, rather than just a cost center.
By swapping subjective feedback for objective data, you move from simply delivering training to strategically engineering employee success and proving L&D’s value to the entire organization.
This same principle powers success across the business. You can see how similar methods are applied by learning about data-driven marketing strategies and how they connect insights to outcomes. The goal is always the same: stop guessing and start making informed choices that move the needle.
Why Data Is Your Strongest L&D Ally

In the world of corporate training, data is your most persuasive advocate. It’s what transforms Learning and Development (L&D) from a department that feels like a cost center into a strategic partner that drives real, measurable business growth.
Think of it this way: a doctor wouldn't guess at a diagnosis based on a patient’s vague symptoms. They run tests—blood work, scans, checks—to get a clear, data-backed picture before prescribing a treatment.
That's exactly what data-driven decision making does for L&D. You stop guessing which training programs might work and start diagnosing specific organizational needs with precision. You use hard evidence to prescribe the right learning solutions, ensuring they directly fix skill gaps and performance issues. This approach fundamentally changes how your team is seen by leadership.
Instead of just sharing a few success stories, you can walk into a meeting with solid numbers that connect your initiatives to tangible business results.
Personalize Learning and Boost Engagement
One of the most immediate wins you'll see from using data is the power to personalize the learning experience. Let's be honest, generic, one-size-fits-all training modules rarely land well. They don't engage employees because they don't address individual needs or existing knowledge levels. Data lets you move way beyond that outdated model.
By analyzing learning data—things like quiz results, content interaction times, and even viewer drop-off points in a training video—you can pinpoint exactly where employees are struggling or excelling. This insight is gold. It allows you to create customized learning paths that challenge your advanced learners while giving extra support to those who need it. The result? Higher engagement and much better knowledge retention.
Data acts as a compass for L&D, guiding you to create training that is not just delivered, but is also absorbed, applied, and ultimately valued by both employees and the organization.
The power of data isn't just an L&D thing, either. Research from McKinsey shows that data-driven organizations are 23 times more likely to acquire customers and 19 times more profitable. These incredible results come from using data to improve efficiency and skills across the board—and that journey often starts with effective employee training.
Connect Training Directly to Business Outcomes
Ultimately, the goal for any L&D department is to prove its value. Data-driven decision making gives you the clearest path to showing a strong return on investment (ROI). By aligning your training metrics with key business performance indicators (KPIs), you can draw a straight line between your learning programs and the company's bottom line.
Here’s how that connection looks in the real world:
- Sales Training: You track the sales performance of reps before and after a new product training module. Did their sales numbers for that specific product go up?
- Safety Compliance: You can correlate a drop in workplace incidents with the completion rates of a new safety protocol video.
- Customer Service: You measure customer satisfaction scores for support agents who have just finished a new communication skills course. Are the scores improving?
Collecting and analyzing this kind of performance data lets you build a powerful business case for every L&D initiative. For a deeper look at tracking and interpreting these user actions, check out our guide on what is behavioral analytics. This framework empowers L&D to finally speak the language of leadership—the language of results, growth, and profitability.
The Core Principles for Data-Driven Training

Jumping into a data-driven approach doesn't mean you need to become a data scientist overnight. It’s really just about shifting your mindset and following a simple, structured process to make smarter decisions that actually move the needle.
For anyone in Learning and Development (L&D), this process boils down to four key pillars. Think of them as a repeatable cycle for continuous improvement, turning your training initiatives from just "courses" into measurable performance boosters.
Pillar 1: Define Clear Business-Aligned Objectives
Before you even think about data, you have to know what you’re trying to achieve. And I don’t mean training goals—I mean business goals. Vague targets like "improve communication skills" are impossible to measure and even harder to prove the value of.
Start with a real business problem. For example, "improve product knowledge" is a pretty weak objective. A strong, data-friendly one sounds more like this: "Reduce customer support tickets related to product feature X by 25% within one quarter." See the difference? Now you have a clear target and a metric to track success.
This focus on measurable outcomes is central to any good data strategy. It’s a concept that applies everywhere—exploring successful data-driven marketing strategies shows the same core idea of connecting every action to a tangible result.
Pillar 2: Collect Relevant and Meaningful Data
With a solid objective in hand, you can now focus on collecting the right data. This is where a lot of L&D teams get tripped up by vanity metrics, like course completion rates. Sure, a 100% completion rate looks fantastic on a report, but it tells you absolutely nothing about whether your team learned anything useful.
Instead, zero in on data that directly ties back to your objective. Here’s what that actually looks like:
- Engagement Metrics: In an interactive video on a platform like Mindstamp, you can see which parts of the video people re-watched or skipped. If everyone keeps replaying one specific segment, that’s a huge red flag that the topic is either too complex or poorly explained.
- Comprehension Metrics: Forget just tracking completions. Use in-video quizzes and questions to check for understanding. If everyone bombs a question about a new compliance rule, you’ve just uncovered a critical knowledge gap that needs immediate attention.
- Behavioral Metrics: This is about observing what happens back on the job. Are the sales reps who took the training actually using the new CRM feature correctly? This is how you connect learning directly to a change in behavior.
The goal is to move beyond tracking activity and start measuring understanding and application. Quality data provides the evidence you need to understand not just if training was completed, but how effective it truly was.
Pillar 3: Analyze and Visualize Your Findings
Raw numbers are just that—numbers. They aren't useful until you turn them into a story. Analysis is all about finding the patterns, trends, and "aha!" moments hidden in your data. You don't need fancy software to get started; a simple spreadsheet can reveal some powerful insights.
For instance, you could plot quiz scores over time to see if knowledge is sticking. Or you could compare the performance data of employees who completed the training against those who didn't. This kind of comparative analysis is one of the simplest and most effective ways to demonstrate the impact of your work.
Visualization takes it a step further by turning your findings into something anyone can understand at a glance, like a chart or a graph. A bar chart showing a 40% decrease in safety incidents after a new training program is way more persuasive to leadership than a spreadsheet packed with numbers.
Pillar 4: Act on Insights and Iterate Continuously
This last pillar is the most important. It's what separates a "data-aware" team from a truly data-driven one. Data is completely useless if you don't do anything with it. Your analysis should always lead to a clear plan of action.
Let's go back to that compliance training example. If you find that 70% of employees are failing a quiz question about a specific new regulation, your next step is obvious. You need to go back and revise that part of the training, maybe by adding a better explanation or a real-world example.
This creates a continuous feedback loop: you define a goal, collect data, analyze it, act on what you find, and then measure the results of your changes all over again. It's a cycle that ensures your training programs are always getting better and more effective over time.
Actionable Frameworks to Get You Started
Theory is great, but putting it into practice is where the real value lies. If you want to make data-driven decisions a reality for your L&D team, you need a repeatable process—a blueprint that turns raw numbers into strategic action. Instead of starting from scratch, you can lean on a few battle-tested models designed for exactly this purpose.
Let's walk through two powerful frameworks. We'll simplify a classic data science model for a training context and then look at a well-known L&D model through a modern, data-centric lens.
This simple flow really gets to the core of any data-driven framework: start with a clear goal, use data to find answers, and make an informed decision.
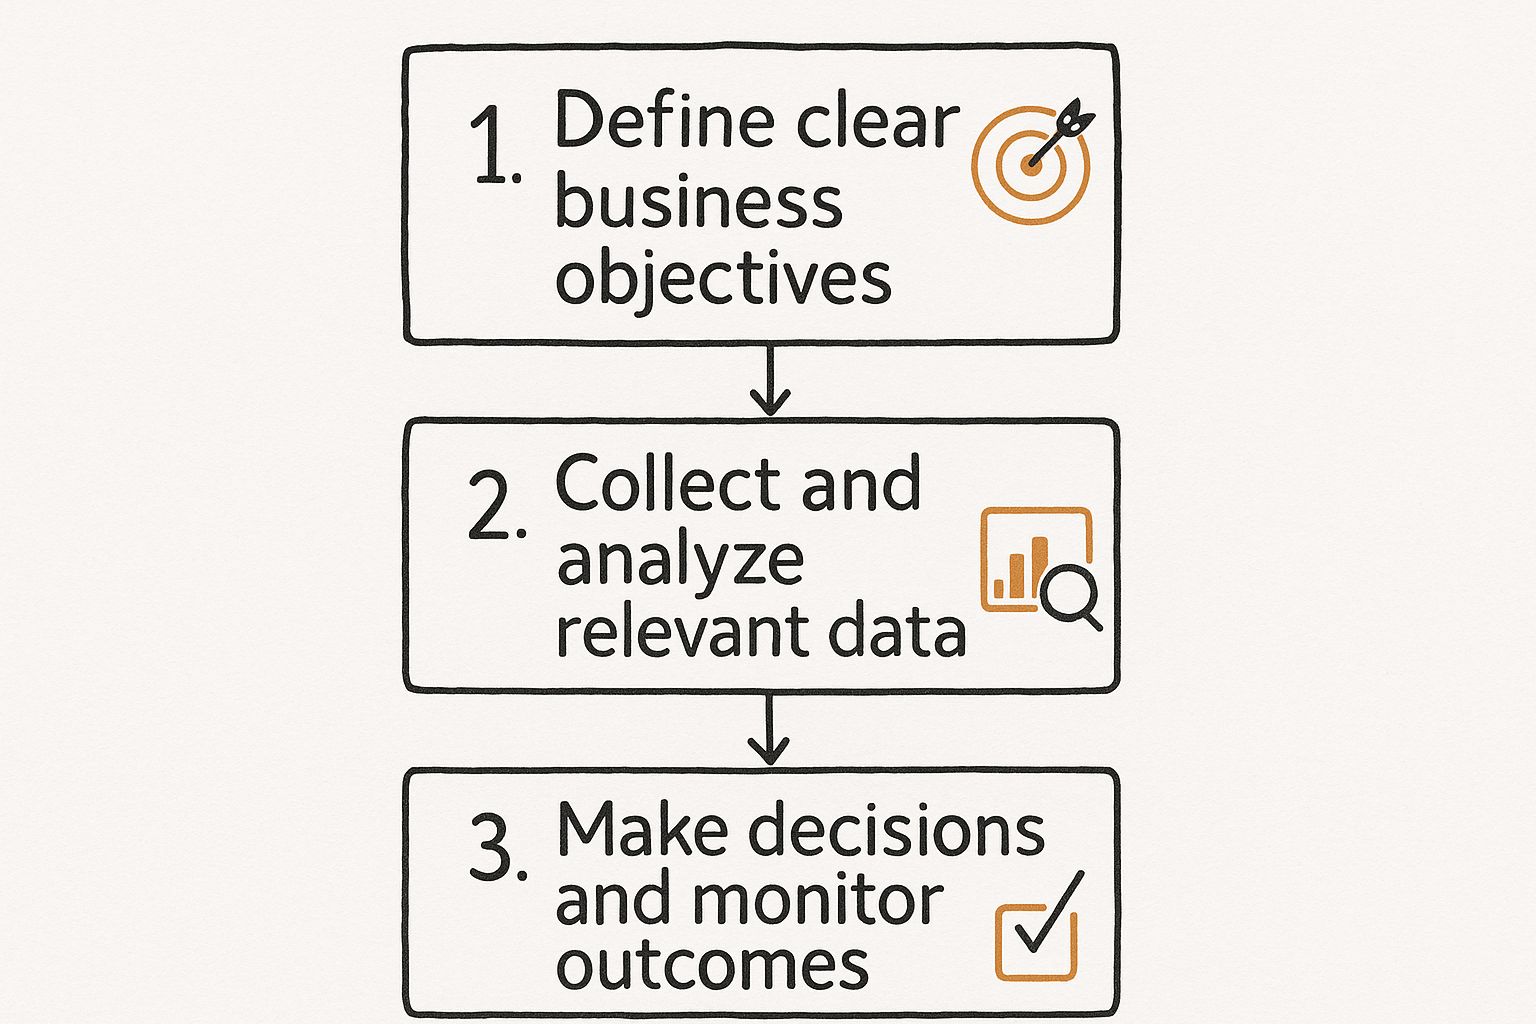
This visual cuts through the noise, showing how every successful data initiative follows this fundamental path to connect what you do with the results you get.
The OSEMN Model Adapted for L&D
The OSEMN model—Obtain, Scrub, Explore, Model, Interpret—is a staple in the world of data science. While it sounds technical, its logic is perfectly suited for training pros trying to find meaningful patterns in their learning data. Let's break down each step using a running example: launching a new sales enablement program.
1. Obtain: This first step is all about gathering your raw data. For our new sales program, this means pulling information from a few different places.
- LMS Data: Course completion rates and initial assessment scores.
- Interactive Video Data: Viewer engagement from Mindstamp, including drop-off points and in-video quiz responses.
- CRM Data: Pre-training sales numbers for each team member.
2. Scrub: Raw data is rarely perfect. This step involves cleaning it up to make sure it's accurate and consistent. This might mean removing incomplete entries (like from employees who only started the training) or fixing mismatched names between your LMS and CRM.
3. Explore: Now the fun begins. You start digging in, looking for trends and potential connections. You might notice that salespeople who re-watched the "Objection Handling" module in your interactive video also had the highest pre-training assessment scores. That's an interesting pattern.
4. Model: This step is really about forming a simple hypothesis you can test. Based on your exploration, your model could be: "Salespeople who master the objection handling techniques will increase their close rate by 15%." This gives you a specific, measurable outcome to track.
5. Interpret: Finally, you present what you've found. After the quarter, you compare post-training sales data against your model. Did the training work as you predicted? The results—whether they confirm or challenge your hypothesis—give you a clear, data-backed story to share with leadership.
Reimagining the Kirkpatrick Model with Data
The Kirkpatrick Model is a familiar name in L&D, evaluating training effectiveness across four levels. Traditionally, Levels 3 and 4 were tough to measure, often relying on subjective observation. A modern, data-driven approach changes that by demanding quantifiable evidence for each stage.
Let’s apply this to our sales enablement program.
Level 1 Reaction: Go beyond "happy sheets." Use in-video feedback prompts in Mindstamp to ask specific questions like, "How confident are you in applying this technique?" This gives you quantifiable sentiment data, not just vague feelings.
Level 2 Learning: Measure knowledge gain with hard metrics. Track the improvement between pre-training and post-training assessment scores. You can even analyze quiz results from your interactive videos to pinpoint the exact concepts that learners struggled with.
By injecting data into each level of the Kirkpatrick Model, you transform it from a theoretical checklist into a powerful tool for proving tangible business impact.
Level 3 Behavior: This is where you connect learning to on-the-job action. Pull data directly from your CRM. Are reps using the new sales methodology you taught? Are they logging activities correctly? This is observable, measurable behavior change.
Level 4 Results: This is the ultimate goal—linking your training directly to business outcomes. Compare the sales performance (e.g., close rates, deal size, sales cycle length) of the trained group against a control group or their own baseline numbers. Did their performance improve as you hypothesized? This provides the definitive ROI.
Unlocking Deeper Insights with Interactive Video Data
Let’s be honest: standard video analytics are pretty shallow. They’ll tell you if someone hit play and maybe how long they stuck around. But they tell you absolutely nothing about whether your employees were actually paying attention, let alone learning anything.
This is where interactive video data completely changes the game for corporate training.
Interactive video gives you a goldmine of specific, granular data that flips the script on how you measure comprehension and engagement. Instead of just hoping your training is effective, you get hard evidence. Platforms like Mindstamp don't just track views; they track every single interaction, response, and choice, giving you a clear window into what your learners are actually thinking. This is the heart of data-driven decision making—using real evidence to guide your strategy.
Going Beyond the View Count
Traditional video metrics can feel good, but they're mostly vanity metrics. A high view count doesn't mean a critical safety protocol was actually understood or a new sales technique was learned. To make decisions that actually improve performance, you need to look deeper.
Here are the kinds of actionable data points you get from interactive video:
- Viewer Drop-Off Points: See the exact moment you start losing people. If everyone is tuning out during the complex explanation of a new software feature, that's a blinking red light telling you that segment needs to be simplified or re-filmed.
- In-Video Question Responses: By embedding questions right into the video, you can check for understanding in real-time. If 80% of your team gets a key compliance question wrong, you've just spotted a massive risk before it turns into a real problem.
- Click-Path Analysis: See what content truly resonates by tracking which interactive elements viewers click on. If employees keep clicking for more information on a certain product, that’s a clear signal of high interest or a knowledge gap that needs to be filled with more detailed training.
This screenshot from the Mindstamp analytics dashboard shows you exactly what this looks like in practice. It visualizes engagement and performance in a way that tells a much richer story.
You're not just seeing who watched; you're seeing how they engaged. That's a world of difference from a simple completion rate.
Turning Interactive Data into Smarter Training
This level of detail allows learning and development pros to stop guessing and start diagnosing training weaknesses with surgical precision. Imagine you've rolled out a mandatory safety training video. If the analytics show a huge drop-off right before the section on emergency evacuation procedures, you have a critical, actionable insight. The content isn't landing, and you need to fix it—fast.
Similarly, if you see consistently wrong quiz answers about a new company policy, you know there's a widespread misunderstanding. With that knowledge, you can create targeted micro-learning modules or schedule a follow-up Q&A to address that specific gap. To get a better sense of what's possible, check out our deep dive into the rich world of interactive video data analytics.
Data from interactive video transforms training from a passive broadcast into an active dialogue. It tells you not only what your employees watched, but what they understood, what confused them, and what they need to learn next.
This feedback loop is incredibly powerful. It allows you to continuously improve your learning content based on how your team actually uses and understands it.
Case Study: Cutting Onboarding Time
Let's look at a real-world example. A fast-growing tech company was struggling with a long, inefficient onboarding process. New hires felt overwhelmed, and knowledge retention was suffering.
They decided to switch their standard video modules to interactive ones on Mindstamp, embedding quizzes, clickable resources, and feedback prompts throughout the content.
The data immediately showed that new hires were constantly re-watching the module on the company’s complex CRM system and still failing the quiz questions. Armed with this insight, the L&D team created a separate, more detailed interactive workshop just for the CRM. The results were astounding. By addressing the precise point of confusion, the company cut its overall employee onboarding time by 30% and saw a huge improvement in new hire performance in their first quarter.
The Future of L&D Is Powered by AI and Automation
If data-driven decision making is the foundation for modern corporate training, then artificial intelligence (AI) and automation are the rocket fuel launching it into the future. These technologies are seriously amplifying what’s possible in Learning and Development (L&D), turning massive datasets into predictive insights almost instantly.
Imagine moving from reacting to training problems to preventing them entirely. That’s the real promise of AI. Instead of just analyzing past performance after the fact, AI can sift through learning data to spot subtle patterns that predict future outcomes. It can flag employees who might be at risk of failing compliance training before they even start, giving you a chance to step in with targeted support.
This proactive approach is fast becoming a competitive must-have. Nearly 65% of organizations are already using or actively exploring AI to boost their data analytics capabilities. AI is shrinking the time it takes to get from data to decision from months down to hours, giving early adopters a crystal-clear advantage. You can dig deeper into how AI will revolutionize decision making and its impact across different industries.
From Personalization to Hyper-Personalization
While data lets us create personalized learning paths, AI takes this a giant leap forward into what’s called hyper-personalization. This is where adaptive learning platforms really shine, creating a truly one-of-a-kind educational journey for every single employee.
These smart systems analyze an individual's performance in real time. Let’s say a learner is struggling with a specific concept in an interactive video. The platform can automatically serve up a different micro-learning module to reinforce the idea or offer a new example to make it click. It's not just about customizing a pre-set curriculum; it’s about dynamically tweaking the content and difficulty on the fly.
AI doesn't just analyze data; it acts on it. It transforms learning from a static, one-way broadcast into a dynamic, two-way conversation that adapts to each user's unique needs.
Building a Smarter L&D Ecosystem
But integrating AI and automation isn’t just about making courses smarter—it’s about building a more intelligent and efficient L&D ecosystem. The whole point is to offload the repetitive, time-sucking tasks of data analysis so L&D pros can focus on strategy, creativity, and high-impact interventions.
Think about these practical applications that are already shaping the future of training:
- Automated Content Curation: AI algorithms can look at an employee’s role, skill gaps, and career goals to automatically recommend the most relevant training content from a huge library. No more wading through irrelevant material.
- Predictive Skill Gap Analysis: By analyzing performance reviews and project outcomes, AI can actually forecast which skills your organization will need down the road and identify current gaps, letting you develop training programs proactively.
- Intelligent Reporting: Forget manually pulling reports. AI-powered dashboards can automatically bubble up the most critical insights, highlighting trends and alerting L&D managers to potential issues without them having to go digging.
Ultimately, AI acts as a powerful amplifier for what is data driven decision making. It takes the data you're already collecting and uses it as fuel to build a more responsive, efficient, and deeply personal learning environment for tomorrow.
Got Questions About Data-Driven Training? We've Got Answers.
Diving into a data-driven approach for corporate training can feel like a big shift, and it’s natural for questions to pop up. It can seem a bit intimidating at first, but getting started is usually much simpler than you'd think. Here are a few common things we hear from L&D pros as they begin their journey.
"I Have Zero Data Analysis Experience. Where Do I Even Start?"
Don't worry, you don't need a Ph.D. in statistics to get started. The key is to begin small. Pick just one training program you know well and focus on a single metric that actually tells you something useful. Think quiz scores for a new compliance module or how many people clicked on the resources in an interactive video.
You can use tools you’re already familiar with, like a simple spreadsheet, to track these numbers over time. Look for obvious patterns. The goal isn't to become a data wizard overnight; it's about building your confidence with small, clear wins.
"What Are the Most Important Metrics to Track?"
It’s time to look past "vanity metrics." A 100% completion rate doesn’t mean much if nobody actually learned anything. Instead, your focus should be on data that points to real, tangible changes in knowledge and behavior.
The best metrics are the ones that draw a straight line from your training efforts to an employee's performance on the job. You want data that tells a story about comprehension, application, and bottom-line impact.
Here are a few metrics that truly matter:
- Learner Engagement Data: Where are people pausing, re-watching, or clicking within your interactive videos? This tells you what's resonating and what's confusing.
- Knowledge Retention Scores: Use assessments before and after training to measure what people actually learned.
- On-the-Job Application: Are you seeing improvements in performance reviews? Are people completing specific tasks more efficiently after the training?
- Business KPI Impact: This is the big one. Can you connect your training to improvements in things like sales figures, customer satisfaction scores, or production numbers?
"How Can I Get Leadership to Invest in Data Tools?"
You need to speak their language, and that language is ROI. Don't frame it as a "nice-to-have" for the L&D department; present it as a solid business case. Show them how having better data will finally allow you to prove—and improve—the financial return on your training programs.
A great way to do this is with a small pilot project. Gather some concrete evidence from a single program. Show how the insights you gained led to a measurable improvement, like cutting down onboarding time by a week or boosting critical compliance scores. When you tie your request directly to solving a problem they already care about, the investment becomes an easy decision.
Ready to unlock the data-driven insights hidden in your training videos? Mindstamp makes it easy to create engaging, interactive learning experiences and track the metrics that matter. Start your free trial today and see the difference for yourself.
Get Started Now
Mindstamp is easy to use, incredibly capable, and supported by an amazing team. Join us!


Try Mindstamp Free


