
Diving Into the Rich World of Interactive Video Data & Analytics


In a world driven by data, Mindstamp has you covered!
Our engineers pride themselves in having one of the most robust, comprehensive reporting tools on the market. Anything within the four walls of a Mindstamp video can be analyzed, visualized, and exported to serve your specific needs.
We offer CSV exports, scheduled reporting, and API and web page integrations to quickly (and easily) collect any data points recorded in Mindstamp. You can use this data to build your own reports and dashboards, or, you can leave it up to the Mindstamp team to build them for you!
Mindstamp has recently introduced Insights, a dynamic reporting dashboard providing you with comprehensive and beautiful reports. On the Insights dashboard, you have the following basic reports:
Video Viewing Data
See the number of views on any given day
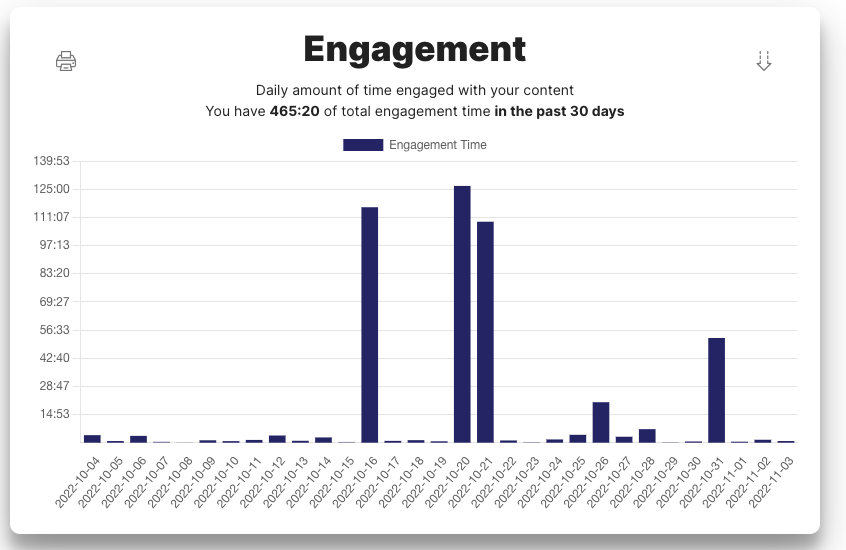
Viewer Engagement Time
How much time did your audience spend engaged with your interactive content?
Unique Viewer Counts
See the number of unique viewers that have viewed your content
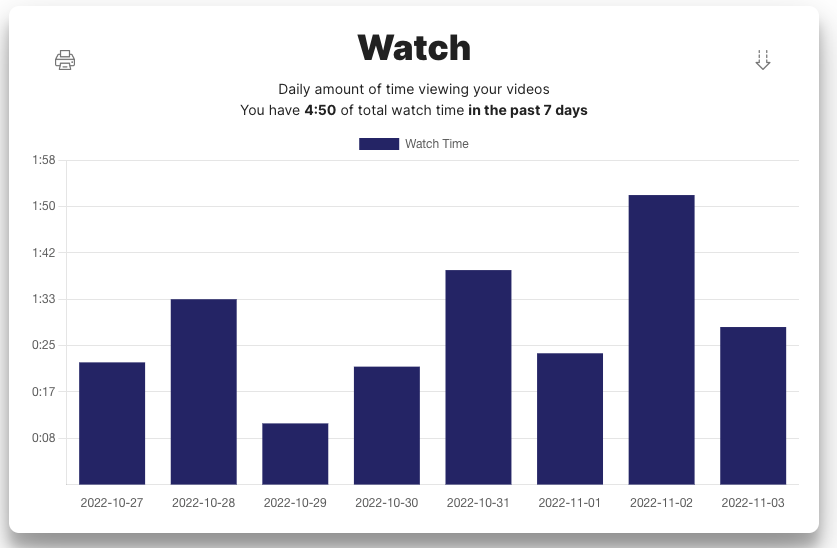
Watch Time
How much time was spent watching your content?
Completion Percentage
See how much of your videos your audience watches, on average
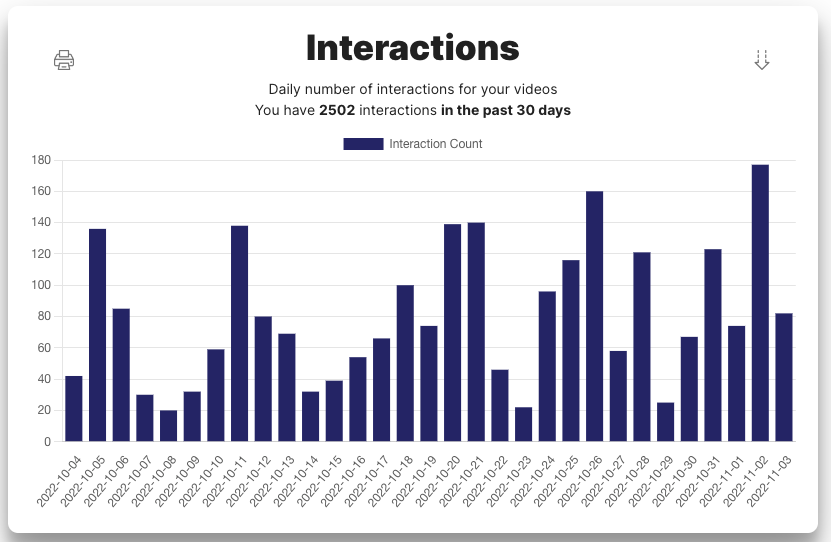
Interaction Counts
See the number of interactions on any given day
Top Videos + Interactions Trends
We alsooffer tables showing your most popular videos and interactions.
These charts and tables alone provide a wealth of information that can help you fine tune your videos to improve engagement across your audience.
However, we didn’t stop there. We also have a geographical chart that shows viewers and interaction by country or by state allowing you to visualize your videos’ performance across different demographics.
Lastly, after listening to your feedback, we have added a new drop off report for your videos. This visual shows your views and interactions throughout the video and which points capture your audience and which cause you to lose viewers.
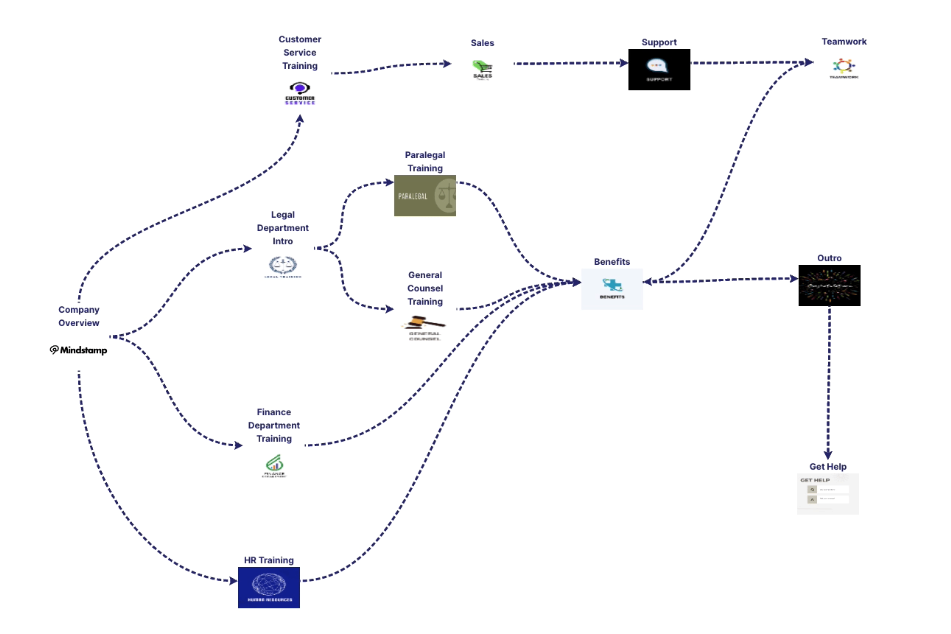
In addition to the Insights dashboard, we have also improved viewing and branching reports. If you click on a view, you will now see what portion of the video was watched and which interactions were engaged with (indicated by green) and what was missed (red). Additionally for branching views, you can see the entire experience from start to finish including what was and what wasn’t viewed and interacted with.
Lastly, we added a branching overview on your videos. Here you can see the potential path any viewer might take while watching a video, making it that much easier to storyboard your audience’s interactive experience.
Ready to unlock the power of Mindstamp’s reporting? Login or sign up for a 7 day free trial to begin using Mindstamp today!
Get Started Now
Mindstamp is easy to use, incredibly capable, and supported by an amazing team. Join us!


Try Mindstamp Free


