

How to Measure the ROI of Your Corporate Training Content


When it comes to corporate training, how do you really know if your content is making a difference? It all boils down to measuring your content marketing ROI—calculating the real, financial return you get from your training content compared to what you spent creating it.
It’s about proving that every dollar spent on learning materials, especially interactive videos, delivers a tangible, positive impact on business performance. This is how you shift the conversation from training being just another expense to being a strategic investment.
Why Measuring Training Content ROI Matters Now
The days of corporate training being a simple checkbox on a compliance list are long gone. Today, every single dollar in the Learning and Development (L&D) budget is under a microscope. Leadership isn't just satisfied with course completion rates anymore; they demand cold, hard proof that training is directly boosting key business goals like performance, productivity, and employee retention.
This puts a ton of pressure on L&D pros to justify every penny. Proving a solid return on investment has become a top priority for pretty much every department. Just look at marketing—in 2025, a whopping 83% of marketing leaders called proving ROI their top priority. That number has jumped significantly in just a few years.
This isn't just a trend; it's a fundamental shift in how businesses operate. With 64% of organizations basing future spending on past performance, the message is clear: show us the value, or the budget disappears.
From Cost Center to Growth Driver
For too long, training has been stuck with the reputation of being a "cost center"—a necessary expense, but not something that actively contributes to the bottom line. Measuring ROI is the only way to shatter that perception.
When you can draw a straight line from your training content to concrete business results, you completely transform L&D's role. It stops being an operational cost and becomes a powerful engine for growth.
This is where a data-driven content marketing mindset for your internal training programs really shines. When you start focusing on measurement, you unlock some serious benefits:
- Secure Budget Approval: Walk into a budget meeting with a positive ROI, and you'll find it's a whole lot easier to get the resources you need for new initiatives.
- Align with Business Goals: The process itself forces you to connect what you're teaching directly to what the C-suite actually cares about, like revenue growth or cost reduction.
- Optimize Your Content: The data doesn't lie. It shows you what’s working and what isn’t, allowing you to fine-tune your training materials for maximum impact.
The core idea is simple but incredibly powerful: connect the engagement within your training content directly to tangible business results. It’s not just about who watched a video, but what they did differently afterward.
For instance, using an interactive video platform like Mindstamp lets you see way beyond simple view counts. You can track actual comprehension with in-video quizzes, pinpoint knowledge gaps with branching scenarios, and see exactly how learners are interacting with critical information.
This kind of granular data is the bedrock for building a credible, data-backed case for the value of your training programs. It sets the stage for a robust measurement framework that proves your team isn't just spending money—it's driving real, measurable success.
Figure Out Your Goals and KPIs Before You Do Anything Else
Before you even think about measuring the ROI of your training videos, you have to define what a “win” actually looks like. Fuzzy goals like “improve skills” or “better onboarding” are impossible to measure. More importantly, they don't mean much to leadership when it's time to talk budget.
You need to get specific. The best way to do this is to take a fluffy idea and turn it into a concrete business objective. For example, instead of just aiming for "better onboarding," a far more powerful goal is to reduce new hire time-to-full-productivity by 15% within their first 90 days.
Now that's a target. It's precise, quantifiable, and tied directly to something the business really cares about: getting new people contributing faster.
Know Your Leading vs. Lagging Indicators
To get a complete picture of your training's impact, you have to track two different types of metrics: leading and lagging indicators.
Think of it like this: leading indicators are the immediate clues that tell you people are actually learning. Lagging indicators are the long-term business results that prove the training actually worked.
Leading Indicators: These are the metrics you can see in real-time as people go through your training videos. They’re great for making quick adjustments.
- Completion Rates: What percentage of employees actually finished the module?
- Quiz Scores: How are they doing on those in-video questions? This shows you if the information is sticking.
- Engagement Metrics: Which resources are they clicking on? What parts are they re-watching? This is gold for figuring out what's resonating.
Lagging Indicators: These are the bigger, retrospective business metrics that show up weeks or months later. They are the ultimate proof of your ROI.
- Performance Reviews: Are employee performance ratings actually improving after the training?
- Sales Figures: Are trained sales reps closing bigger deals or shortening their sales cycles?
- Employee Retention: Is turnover going down for teams that completed specific development programs?
You absolutely need both. Leading indicators give you early wins and show that your content is doing its job on a micro level. Lagging indicators are what connect that engagement to the bottom line, which is what gets your stakeholders to sit up and pay attention.
Real-World Goals and KPIs in Action
Let's make this practical. The trick isn't just to list a bunch of metrics, but to map them directly to a specific business problem you're trying to solve.
Scenario 1: Sales Enablement
- Vague Goal: Help the sales team sell the new product better.
- SMART Goal: Increase the average deal size for the new product line by 10% among trained sales reps within Q3.
- Leading KPIs: 95% completion rate of the interactive product video; average score of 90% on the features quiz.
- Lagging KPIs: Average deal size; win rate for new product deals; sales cycle length.
Scenario 2: Compliance Training
- Vague Goal: Make sure everyone completes their annual compliance training.
- SMART Goal: Achieve a 100% completion rate with a minimum 95% pass rate on the final assessment by the end of the fiscal year, reducing compliance-related incidents by 25%.
- Leading KPIs: Video completion rates; pass/fail rates on scenario-based questions.
- Lagging KPIs: Number of reported compliance incidents; audit pass rates.
By defining these specific goals and KPIs upfront, you build the foundation for a credible ROI calculation. You're no longer just creating content; you're building a targeted intervention designed to produce a measurable business result.
Turning Views into Verifiable Value with Interactive Video
Let's be honest: standard video analytics are pretty one-dimensional. They’ll tell you if someone hit play, but they won't tell you if the content actually landed. Did they get it? Did it change anything? When you're trying to prove the ROI of your training content, that's a huge blind spot.
This is where interactive video completely changes the game. It’s not just about watching anymore; it’s about participating. By embedding interactive elements directly into your training, you create a powerful feedback loop that shows you exactly what your team is learning.
Platforms like Mindstamp are built for this. You can drop in questions, clickable areas, and branching paths that turn a passive video into an active data collection tool. Suddenly, you're not just presenting information—you're diagnosing comprehension in real time.
From Watching to Doing: Capturing Actionable Data
The magic happens when you start layering in interactive features. Every click and every answer becomes a data point, painting a rich picture of how your learners are engaging with the material. This goes so much deeper than a simple view count.
Here are a few of the most effective features for gathering the data you need:
- In-Video Questions: Pop in a multiple-choice, open-ended, or even a video response question right after you explain a key concept. The answers immediately tell you who's on track and who might need a little more help. It's instant feedback.
- Clickable Hotspots: You can overlay clickable zones—visible or invisible—on top of products, diagrams, or specific parts of the screen. Tracking what people click on shows you exactly what piques their curiosity or where their attention is focused.
- Branching Scenarios: This is perfect for soft skills or compliance training. You can present a situation and let the viewer choose their response, with the video branching to a different path based on their decision. Their choices give you clear, undeniable data on their decision-making process.
This screenshot from Mindstamp gives you a sense of how easy it is to layer these interactive moments right onto your video's timeline.

Think of each of these features as a bridge connecting your training engagement directly to those business KPIs you set earlier.
Real-World Scenarios for Data-Driven Training
So what does this look like in practice?
Imagine you're rolling out a new training module for your sales team. Instead of just seeing who completed the video, you can use in-video quizzes to pinpoint which product features your reps are consistently getting wrong. Now you can offer targeted follow-up training right where it's needed most, which has a direct line to improving their sales performance.
Or, think about a mandatory compliance module. Interactive scenarios can show you precisely which employees are fuzzy on key policies. This isn't just about ticking a box; it's about proactively reducing compliance risk and creating a clear audit trail of who actually understood the material, not just who watched it. The data shows that this format pays off, too. In fact, 45% of marketers say video is their highest-performing content type.
By turning your video into a two-way conversation, you collect the specific evidence needed to prove its value. The data moves from "who watched it?" to "who gets it?"—a critical distinction when measuring ROI.
This is the kind of granular detail that makes your ROI calculation so much more compelling. You can dive into the rich world of interactive video data analytics to see how every single click, answer, and choice can be tracked and analyzed. This data becomes the foundation for linking your training efforts directly to measurable improvements in business performance.
Connecting Training Metrics to Business Outcomes
The data you've gathered from your interactive training videos is powerful, but it's really only half the story. The real challenge—and where you prove your value—is drawing a clear, undeniable line from those learning metrics to tangible business results.
This is how you start measuring content marketing ROI in a way that actually gets the C-suite’s attention.
We have to move beyond training-specific numbers like completion rates and quiz scores. Instead, we need to correlate them with the high-level metrics your company already tracks obsessively, like revenue growth, cost savings, and employee retention. It’s all about building a defensible case that shows your L&D efforts are a direct contributor to the company's success.
Creating a Control Group for Clear Comparison
One of the most effective ways to isolate the impact of your training is by using a control group. This classic scientific method gives you a clean baseline for comparison, making your results far more credible.
Imagine you're launching new interactive product training for your sales team. Instead of a company-wide blast, you could:
- Train a specific team: Roll out the new interactive video training to one regional sales team (this is your test group).
- Establish a baseline: Let another, similar regional team continue business as usual without the new training (this is your control group).
- Measure and compare: After a set period, like one quarter, compare the sales figures between the two groups.
If the trained team shows a 15% higher close rate on the new product, you’ve got a fantastic, specific data point. This isn't just a random success; it's a measurable lift you can tie directly back to your training.
Analyzing Performance Before and After Training
Another super practical method is the good old before-and-after analysis. This approach works especially well when you're implementing training designed to improve efficiency or cut down on errors.
A perfect example is deploying a new software training video. The process is pretty straightforward:
- Benchmark the problem: Before you launch anything, pull data on a relevant business metric. For instance, track the number of help desk tickets related to the software for one month. Let's say you average 200 tickets.
- Deploy the training: Roll out your interactive video module to all users.
- Measure the impact: After the training is complete, track that same metric for the following month. If the ticket volume drops to 120, that’s a 40% reduction.
This isn't just a learning outcome; it's a direct operational improvement. You can even translate this into cost savings by calculating the average cost per help desk ticket, turning your training data into a hard financial number.
Ultimately, connecting these dots is what separates a cost center from a strategic business partner. By using methods like control groups and before-and-after analysis, you transform abstract learning data into a compelling narrative of business impact, proving the immense value of your corporate training content.
Calculating and Presenting Your Training ROI
You've collected the data and connected it to real business outcomes. Now it's time to boil all those insights down to a single, powerful number that gets everyone's attention: your training ROI.
This is the final step, the one that translates all your hard work with engagement metrics into the language executives speak fluently—money.
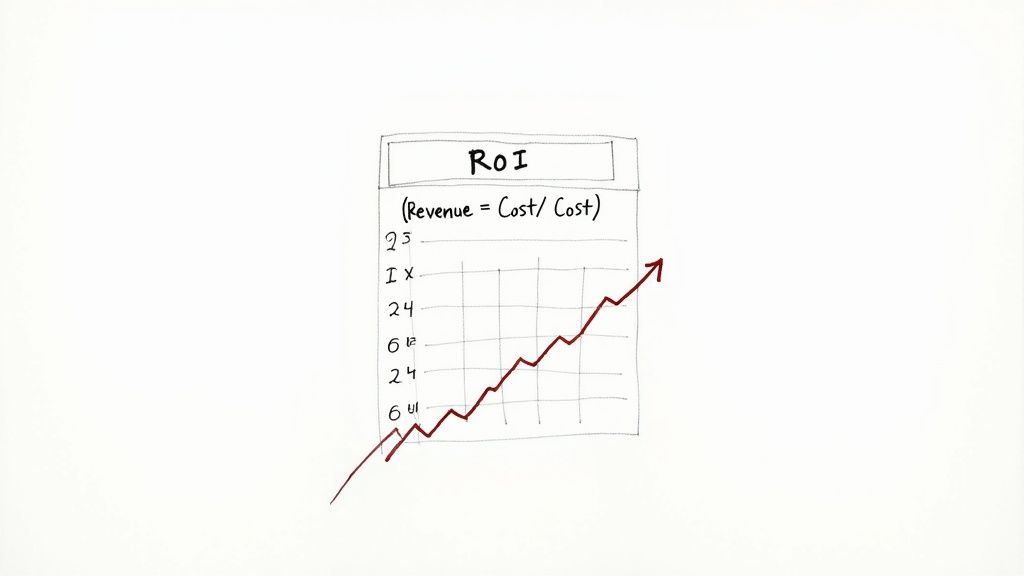
The formula itself looks simple enough, but its real power comes from the credible, well-documented data you’ve already gathered.
(Net Profit from Training - Cost of Training) / Cost of Training * 100 = ROI %
Let's unpack each part of this so you can build a calculation that's both practical and bulletproof.
How to Monetize Your Training's Net Profit
Figuring out the "Net Profit" is always the most critical—and often the trickiest—part of the equation. This isn't just about direct revenue. It's about putting a dollar value on the improvements and efficiencies your training created.
- For Sales Training: This one’s usually the most direct. If your control group comparison showed a $50,000 lift in sales for the trained team, that’s your starting point. Easy.
- For Efficiency Training: Here, you're looking at cost savings. Let's say your new software training cut down help desk tickets by 80 per month. If each ticket costs the company $25 to resolve, you've just created a monthly saving of $2,000.
- For Onboarding: Think about the value of getting people up to speed faster. If new hires are fully productive two weeks earlier than before, and their value to the company is $1,500 per week, you’ve generated $3,000 in value for every single new employee.
Tallying Up the True Cost of Training
Next up is the cost. You need a complete picture of your investment, which is almost always more than just the software licenses.
Be sure to account for everything:
- Content Creation: Don't forget the hours your instructional designers and subject matter experts poured into this.
- Technology: The subscription for your interactive video platform (like Mindstamp) goes here.
- Distribution & Promotion: The time and resources you spent getting the training in front of people.
- Employee Time: This is a big one. You have to factor in the cost of employees' time while they are actively in training instead of doing their primary job.
This simple infographic below gives you a nice visual of how these numbers all flow together.
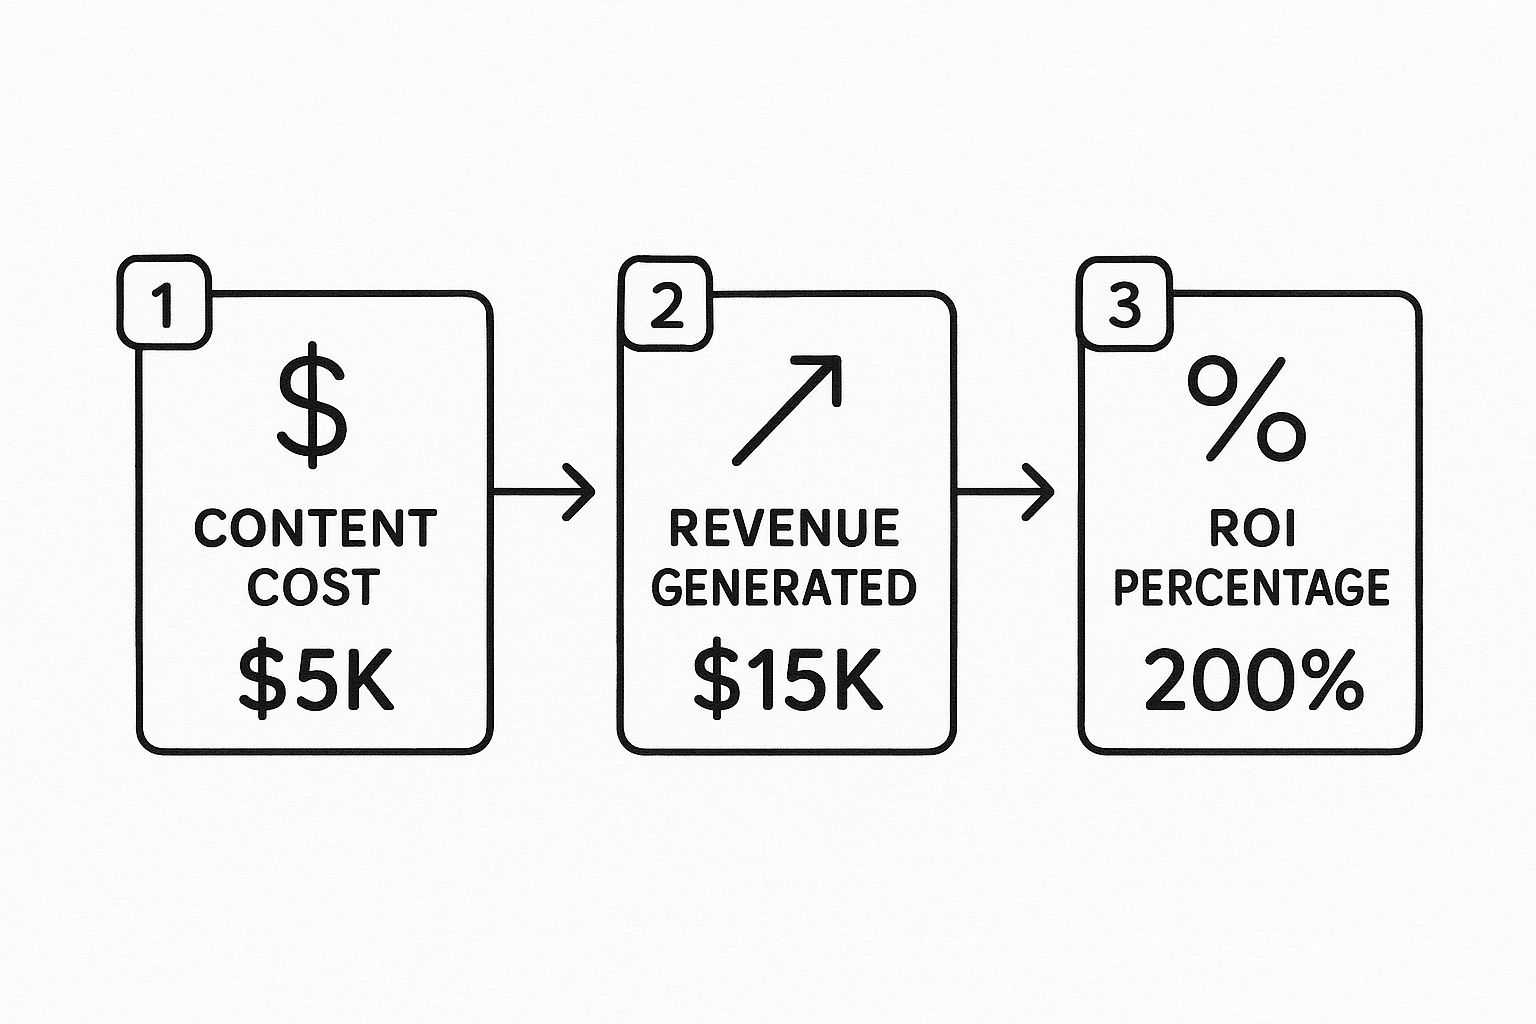
As you can see, a well-planned investment in training content can generate a seriously significant positive return.
Tell a Story with Your Numbers
Finally, don't just walk into a meeting and drop a percentage on the table. You have to tell the story behind that number.
Your ROI report needs to highlight not just the financial return, but the strategic value. Always frame your results in the context of the initial business problems you were trying to solve.
Instead of just saying, "We achieved a 200% ROI," lead with something more compelling: "Our initiative to improve sales skills generated $2 in new revenue for every $1 we invested in training."
A clear, confident narrative backed by solid data is hands-down the most effective way to communicate your success and get the buy-in you need for future projects.
For a deeper dive into this whole process, check out our complete guide on training evaluation methods.
Common Questions About Measuring Training ROI
Even with a solid framework in place, trying to pin down the ROI of your content marketing for corporate training can bring up some tough questions. Let's walk through a few of the most common hurdles L&D pros hit when trying to connect their training content to real, tangible business value.
How Can I Measure the ROI of Soft Skills Training?
This is a big one. Measuring the return on soft skills like leadership or communication can feel a bit like trying to nail Jell-O to a wall, but it’s absolutely doable. The trick is to stop chasing direct financial metrics and instead focus on strong proxy indicators that show a real change in behavior and its impact on the business.
Think about a leadership development program. Instead of looking for a dollar amount, you could track:
- Team Retention Rates: How do turnover rates compare on teams managed by newly trained leaders versus a control group? Lower turnover isn't just a "nice to have"; it represents serious cost savings in recruitment and onboarding.
- Employee Engagement Scores: Run some pulse surveys before and after the training to see if there's a measurable bump in team morale and satisfaction.
- Promotion Velocity: Are the employees who go through the training program getting promoted faster than their peers? That's a powerful indicator of impact.
This is where interactive video really shines. You can build out complex, scenario-based questions that actually test decision-making and communication styles. This gives you quantifiable data on how behavior is improving, closing that gap between what's learned in a video and what's applied on the job.
What if I Can’t Access Business Performance Data?
Hitting a wall when you try to get access to a CRM or HRIS is a classic problem. Your best first move isn't to send another email, but to build a genuine partnership with department heads. You have to frame your request as a way to help them hit their goals.
Start with the data you already have. Show them the detailed analytics from your interactive video platform—completion rates, quiz scores on critical compliance topics, where viewers are dropping off. Position this "learning data" as a leading indicator of performance.
When you can walk up to a department manager and show them that 75% of their team got stumped by a specific product feature in a training video, you suddenly have their full attention. Proving that initial value often opens the door to getting the broader business metrics you need for the full ROI picture.
How Long Does It Take to See a Positive ROI?
The timeline for seeing a return can vary wildly depending on the training's goal, and it's so important to set realistic expectations with stakeholders right from the start.
For a super-focused sales enablement module on a new product, you might see a measurable lift in sales figures within a single quarter. It’s quick and direct.
But for a broader, more ambitious leadership development program? It could easily take 12-18 months to see those tangible results show up in retention numbers or overall team performance. The key is to define both short-term engagement KPIs (like getting 90% completion rates within 30 days) and long-term business KPIs (like performance improvement over one year) to show you're delivering value every step of the way.
Ready to turn your training videos into a data-driven engine for proving value? With Mindstamp, you can embed questions, track comprehension, and gather the specific analytics you need to calculate a credible ROI. Discover how our interactive video platform can transform your corporate training by visiting https://mindstamp.com to start your trial today.
Get Started Now
Mindstamp is easy to use, incredibly capable, and supported by an amazing team. Join us!


Try Mindstamp Free


