 Brett Lindenberg
Data-driven content marketing means you choose what to publish, how to shape it, where to share it, and what to update by looking at evidence about your audience and your results. The evidence comes from the searches people use to find you, what they do on your pages and in your videos, the questions they ask your sales and support teams, and the results each piece produces, such as sign-ups or booked demos. A data-driven content strategy puts the goal, the sources, and the metric for each piece into one written plan that you review on a schedule. The data narrows the options, and your team still makes the call. The short demo below gives you one piece of viewer evidence and asks which content brief you would write next.
Data-driven content and data-backed content
People use "data-driven content" for two different things, and the searches that reach this page ask about both.
- Data-driven content marketing is a way of working. You use audience and performance data to pick topics, write briefs, distribute, and update. Most of this guide covers it.
- Data-backed content is a type of content. The piece itself is built on data: an original survey, a benchmark report, or a personal summary such as a year-in-review. The data-backed content section below covers how to publish it and which companies do it well.
Most teams need the first before the second. You cannot decide which report is worth a quarter of research until you know what your audience asks.
What is a data-driven content strategy?
A data-driven content strategy is a written plan that ties each piece of content to a business goal, an audience question, and a metric, and names the data you check before and after you publish. A useful one fits on two pages and holds these parts:
- One business goal for the content program, such as trial sign-ups from organic search or qualified demo requests.
- The audience segments you write for, and the questions each segment asks, with the source of each question.
- A metric for each stage: reach (did people find it), engagement (did they read or watch), and outcome (did they act).
- The data sources, who checks them, and how often.
- Rules for what happens after review: update, merge, promote, or retire a piece.
Plans often leave out the last part. Then the data piles up in dashboards while the content calendar stays the same.
Where the data for content decisions comes from
Most of the data you need is already in tools you use. The table lists the sources that change content decisions and a tool for each (tools checked October 2026).
| Source | What it tells you | Where to get it |
|---|---|---|
| Search queries | The words people type, which of your pages Google shows for them, and how often people click | Google Search Console (free). Paid suites such as Semrush and Ahrefs add queries you do not rank for yet. |
| On-site behavior | Which pages hold attention and which lead to a sign-up or other key event | Google Analytics 4 (free) |
| Sales and support conversations | Objections and questions in your buyers' own words | Your CRM, such as HubSpot, plus call notes and ticket tags |
| Social and community | What people share, argue about, and ask in public | Each network's own analytics. The old TweetDeck address now opens X Pro behind an X login. |
| Video and interactive content | Which path viewers choose, what they answer, and where they stop watching | Your video platform's per-viewer report, such as Mindstamp reporting for interactive marketing videos |
| Surveys and interviews | Why people act, which the other sources cannot tell you | A one-question survey after sign-up, and a few customer interviews each quarter |
Data also differs by who collected it. First-party data is what you collect yourself, from analytics, your CRM, surveys, and video answers. Second-party data is a partner's first-party data that they share with you under an agreement, for example two companies that run a joint webinar. Third-party data is collected by someone else across many sites and sold. For content decisions, first-party data is the most useful because it describes your own audience.
The push toward first-party data used to be framed as a race against the end of third-party cookies. That deadline did not arrive: in October 2025, Google said Chrome will keep its current approach of offering users a choice about third-party cookies. The reason to build first-party data is the same as before. Third-party segments describe people in general, and your content has to answer the people who come to you.
How to build a data-driven content strategy in six steps
Run all six steps once to set up the plan. After that, repeat steps 3 to 6 every month.
1. Choose one goal and a metric for each stage
Write the goal as a number you can count, then pick one metric for reach, one for engagement, and one for the outcome. For a goal of trial sign-ups from organic search, that could be clicks in Search Console, engagement rate in GA4, and the sign-up key event in GA4. GA4 counts a session as engaged when it lasts longer than 10 seconds, has a key event, or has two or more page or screen views, so engagement rate is a fair first filter for pages that answer the visit and pages that do not.
2. Audit what you already publish
Export the Search Console Performance report by page and by query. The report shows clicks, impressions, click-through rate, and average position, and Google keeps 16 months of data, enough for a year-over-year comparison. Put every page into one of these groups:
- Many impressions and a low click-through rate: the page appears but the title and description do not earn the click. Rewrite them.
- An average position just off the first page: the page is close. Answer the query more directly and more completely.
- Clicks but a low engagement rate in GA4: people arrive and leave. Move the answer into the first paragraph and cut the warm-up.
- Two pages that compete for the same query: merge them into one and redirect the weaker URL.
- No impressions and no links after 16 months: retire the page or merge what is useful into a stronger one.
We use the same rules on our own blog. This page absorbed an older post of ours about data-driven training strategies after that post earned no clicks from search in 90 days.
3. Collect the questions your audience asks
Questions make the best briefs because each one names what the reader needs. Pull them from three places:
- In Search Console, filter the Queries tab for words such as "how", "what", and "why". Long questions with a few impressions each often show a topic you have not covered.
- Ask sales and support for the questions they heard most this month, word for word. Tag tickets by topic so the count builds up without extra work.
- Ask viewers directly inside a video. A question in an interactive video such as "What do you want to see next?" records each answer by viewer, and Reporting > Questions shows the breakdown. Questions pause the video, so place one at a natural break, such as the end of a section.
Our help article on using video data to plan future messaging walks through the setup, including how to pass the campaign source into the video link so you can compare answers by audience.
4. Write a brief from the evidence
A brief turns the evidence into instructions a writer or video producer can follow. Keep it short and fill every field. The example uses the scenario from the demo above.
| Field | Example |
|---|---|
| Evidence | In a product video, most viewers chose the "LMS integration" path and kept asking how completion records reach the LMS. |
| Reader and their job | A training manager who has to prove course completion to an auditor |
| Question the piece must answer | What data goes to the LMS, when it goes, and what to check if it does not arrive |
| Format | A plain-language guide with one diagram and a short video walkthrough |
| Search query, if any | The phrase readers use in Search Console, for example "LMS completion tracking" |
| Metric and review date | Engagement rate and help-desk tickets on the topic, reviewed 30 and 90 days after publishing |
| Next step for the reader | Open the setup checklist |
If you want the brief to feed a production schedule, our guide to a content creation workflow covers the stages and roles after the brief.
5. Publish, distribute, and tag every link
Tag the links you share so each visit carries its source. Google's guidance is that you should always use utm_source, utm_medium, and utm_campaign. Without them, newsletter and social visits blur into direct traffic, and you cannot tell which channel worked.
The same tags can travel into a video. When a Mindstamp video link or embed carries a parameter such as utm_source=newsletter, the player saves it as a variable on the view, so you can filter answers and clicks by source later. See how to pass URL parameters into an embed.
6. Review, then update, merge, or retire
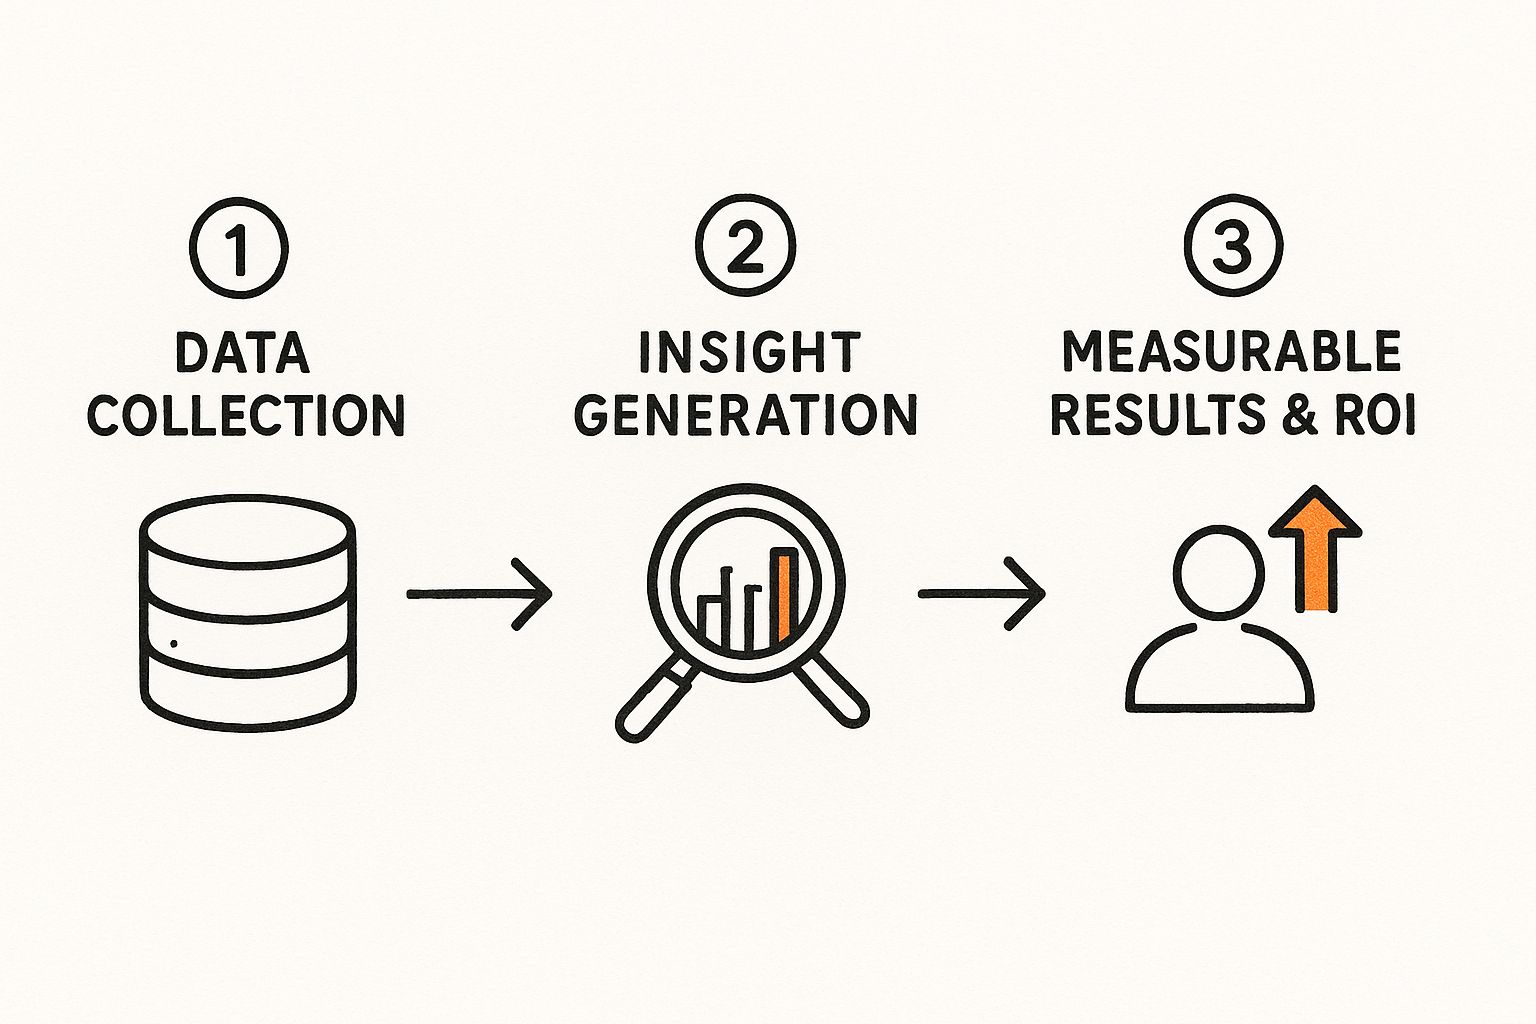
Set the review dates when you publish. Engagement data is useful within a few weeks. Search data needs longer, because a new page can take weeks or months to settle in the results. At each review, compare the piece with the metric in its brief and take one of the actions from step 2. Write down what you changed and why, so the next review can tell whether the change worked.
How to measure data-driven content
Report reach, engagement, and outcome separately. A page with high reach and no outcome needs a different fix from a page with a strong outcome and little reach.
| Stage | Metrics | Where to find them |
|---|---|---|
| Reach | Impressions, clicks, click-through rate, average position | Search Console; each social network's analytics |
| Engagement | Engagement rate, average engagement time, video watch percentage, answers and clicks in a video | GA4; your video platform |
| Outcome | Key events such as sign-ups and demo requests, contacts created, deals influenced | GA4; your CRM |
Attribution: what changed
First-touch, linear, and time-decay models still appear in many attribution guides, but Google Analytics no longer offers them. GA4 now offers data-driven attribution, paid and organic last click, and Google paid channels last click, and Google states that the first click, linear, time decay, and position-based models are no longer available as of November 2023. In HubSpot, contact create attribution reports need Marketing Hub or Content Hub Professional or Enterprise, and deal create and revenue attribution reports need Marketing Hub Enterprise (HubSpot knowledge base, checked October 2026).
Content often brings in a visitor who converts later through another channel, so last-click reports undercount it. A simple check is a GA4 exploration with the Landing page dimension, which records the first page of each session, and the key events metric. It shows which pages people entered on before they converted. For the formula and a fuller method, see our guide to measuring content marketing ROI, and for metric definitions by channel, see content engagement metrics.
A dashboard without a data analyst
Google renamed Looker Studio back to Data Studio, and it is still a no-cost tool. It has connectors for Google Analytics and Search Console, so one report can show the three stages side by side. Keep the first version to the metrics in your strategy document, and add a chart only when someone will act on it.
Reading video data
Judge a video's watch percentage against its length. Across 8.07 million views of 18,315 Mindstamp videos (2018 to October 2026), the average view played 46.5% of the video. Videos of one minute or less averaged 59.4% watched, and videos of 2 to 5 minutes averaged 39.2%. These are Mindstamp customer videos, mostly training, marketing, and sales, so treat the figures as a rough reference and not as an industry benchmark. Watch percentage and drop-off show where attention fell. Answers and choices show what the viewer wanted, and a content plan can act on that. Our post on video engagement metrics defines each measure.
Using AI in data-driven content creation
Most marketers now use AI somewhere in production. HubSpot's 2026 State of Marketing report says 80% of marketers use AI for content creation, a figure that Typeface cites in its 2026 roundup of content marketing statistics.
Google's guidance says appropriate use of AI or automation is not against its guidelines, while automation used mainly to manipulate rankings breaks its spam policies. The spam policies name scaled content abuse, which includes using generative AI to produce many pages without adding value for users.
The way to automate without looking cheap is to automate the pattern work and keep people on the parts readers judge you by. AI does the first group well:
- Clustering a few thousand Search Console queries into topics
- Summarizing a month of support tickets into recurring questions
- Drafting an outline from a finished brief
- Cutting a long piece into short versions for email and social
People should own the claims, the examples, the first-party data, and the final edit. Before a piece goes out, check that it contains at least one fact, example, or number that only your team has, that a named person checked every claim, and that every statistic links to its source. If you cannot add anything a competitor's page lacks, skip that query. For a broader primer on AI tools in marketing, Mohr Marketing's introduction to artificial intelligence in digital marketing covers uses such as chatbots and predictive analytics.
Data-backed content: examples and how to publish it
Data-backed content earns links and citations because other writers need numbers to quote. It also costs more to make, so pick a question your audience asks and that your data can answer.
Which companies excel at creating data-driven content?
Three examples show the main patterns:
- Spotify Wrapped turns each listener's own year into a summary of minutes listened, top songs, top artists, and genres. The 2025 edition launched on December 3, 2025. It works because each person gets their own data in a form worth sharing.
- Google's Year in Search publishes the year's trending searches by country, and the 2025 global list starts with Gemini. It turns aggregate behavior on Google's own platform into an annual report.
- HubSpot's State of Marketing survey is cited by other publishers, as the Typeface roundup above shows. A survey on a question your audience cares about, published with its method, can earn citations the same way.
A smaller company can use the same patterns at its own scale: an annual summary of anonymized usage data, a short benchmark from a customer survey, or a personal results page for each user.
How to publish data-backed content readers trust
- State the source, the sample size, and the dates the data covers.
- Explain the method in two or three sentences, including what the data cannot show. A pattern in the data is not proof that one thing caused another.
- Give every number a unit and a subject, and do not round in a way that changes the meaning.
- Offer the summary table so others can cite it accurately.
- Put an "updated" date on the page and refresh it when new data arrives.
Data-driven content for training teams
Training content follows the same loop. The signals are different: answers to each question, retries, completion by role, and what learners do on the job afterward. Three practices carry over well from marketing:
- Segment learners by role and by a short pre-assessment, so each group sees the material it needs.
- Set a follow-up rule for a clear signal, such as a focused review when a learner misses the same question twice. Our training trigger rule example lets you pick which event should open a review.
- Change one thing at a time in a course and compare the same measure before and after.
Training data can support decisions about development and promotion only when it measures skill. A completion record shows attendance. Assessment answers and evidence from the job show ability. For the decision side, see data-driven decision making. For what to measure, see how to measure training effectiveness. For tracking what learners do inside a course, see what behavioral analytics is and how it works.
Common questions
How do I start data-driven content marketing on a small budget?
Use the free tools first. Search Console shows the queries that already reach you, GA4 shows which pages hold attention and lead to sign-ups, and Data Studio puts both in one report. Ahrefs Webmaster Tools is free for websites you verify and shows the pages and keywords that bring organic traffic and who links to you. Add your sales and support questions in a shared spreadsheet, and you have enough evidence to plan a quarter.
What is question-driven content?
Question-driven content is planned from the exact questions your audience asks: search queries phrased as questions, questions from sales calls and tickets, and answers viewers give inside your videos. Each piece answers one question in its first paragraph. It is the most direct form of data-driven content, because the reader wrote the brief for you.
How can I design a content pipeline that tests multiple versions?
Decide the metric before you test, change one element at a time, and give each version enough views for the difference to hold up. Titles, opening paragraphs, and calls to action are the cheapest elements to test. For video, you can compare call-to-action wording, form placement, and question timing on the same asset, as described on our video A/B testing page. Our guide to A/B testing videos covers how to split traffic and read the result.
What are the best practices for data-driven content in the UK?
The same practices apply, with UK data protection rules on top. Under the Privacy and Electronic Communications Regulations (PECR), the ICO says you must tell people about the cookies you set and get their consent, except for cookies that are strictly necessary for the service they asked for. The ICO's cookie guidance says it is consulting on a revised version, so check the current page before you change analytics or tracking. Content decisions rarely need data about one named person, so work from aggregate reports where you can.
To start this week, export three months of Search Console queries, pick the five questions with the most impressions that no page of yours answers well, and write one brief using the template above. Review it 30 days after it goes live.
Sources and further reading
- byyd: What awaits content marketing in 2025, according to Statista (June 2025 summary of Statista's Content Marketing Trend Study 2025)