

How to Measure Student Engagement: Effective Strategies


Understanding What Real Student Engagement Looks Like
 Before we can measure something, we first have to agree on what we're actually looking for. When it comes to student engagement, it’s so much more than seeing hands in the air or a quiet, compliant classroom. A student staring intently could be deeply absorbed in a complex problem—or they could be daydreaming about lunch. To really understand how to measure student engagement, we need to look beyond these surface-level actions.
Focusing on just one aspect, like whether homework is turned in, gives you an incomplete and often misleading picture of what's happening. True engagement is much more layered.
The Three Pillars of Student Engagement
I like to think of real engagement as a three-legged stool. If one leg is wobbly, the whole thing is unstable. It’s a mix of thinking, doing, and feeling, and you need all three for a student to be truly invested.
Let's break down these pillars:
- Cognitive Engagement: This is the "thinking" part. It’s about the mental effort a student puts in. Are they simply memorizing facts to pass a test, or are they wrestling with difficult ideas, asking thoughtful questions, and trying to connect new concepts to what they already know? A cognitively engaged student is driven by a desire to understand, not just to complete a task.
- Behavioral Engagement: This is the "doing" part, and it's the one we see most easily. It includes things like participating in discussions, following class rules, handing in assignments on time, and working with classmates. While it’s definitely important, it's a classic mistake to assume that good behavior equals full engagement.
- Emotional Engagement: This is the "feeling" part of the equation. It gets at a student's sense of belonging, their personal interest in the subject, and the quality of their relationships with their teacher and peers. When a student feels safe, valued, and connected, they are far more likely to put in the behavioral and cognitive effort.
Seeing the Whole Picture
Think about a student who always does their homework (high behavioral engagement) but admits the class is boring and doesn't really talk to anyone (low emotional engagement). Chances are, their cognitive investment is just enough to get by. If you only measured their homework completion rate, you'd have a completely inaccurate view of their connection to the material.
This is a challenge schools everywhere are facing. A 2024 survey of nearly 3,000 high school students revealed that engagement is a complex mix of these cognitive, social, and emotional factors, underscoring how students' connection to learning has changed. You can explore a full analysis of these post-pandemic engagement trends for a deeper dive.
Getting a handle on these different dimensions is the essential first move toward a more meaningful way of tracking engagement. Interestingly, many of the same principles apply to how people interact with online content. It can be useful to learn about content engagement metrics to get a broader perspective on what keeps an audience hooked.
Surveys and Assessment Tools That Actually Get Results
Let's be real for a moment. When you bring up "student surveys," you can almost feel the collective eye-roll. Most are a chore—too long, filled with generic questions, and feel like just another box to check. But what if they could be powerful tools for peeking inside your students' minds? The secret isn't just in the questions you ask but in how and when you ask them.
Designing Surveys That Students Actually Complete
The first hurdle is moving away from the one-size-fits-all questionnaire. The best surveys I've seen feel more like a quick chat than an interrogation. Instead of a vague question like, "Rate your engagement," which students don't know how to answer honestly, try something more concrete: "When did you feel most focused during last week's project?" This simple shift gives you data you can actually use.
Here are a few tips I've picked up for creating surveys that don't get ignored:
- Keep them short and sweet. Think "pulse" surveys—just a handful of questions that take less than five minutes. A quick weekly check-in is far more telling than a monster survey once a semester.
- Mix up the format. Don't just rely on multiple-choice. Open-ended questions like, "What was one thing that confused you this week?" can be a goldmine for qualitative insights.
- Time it right. Sending a survey on a Friday afternoon is a recipe for disaster. Try a quick poll at the start of class on a Tuesday or Wednesday when students are generally more tuned in.
For a bigger picture, many institutions turn to established tools to measure student engagement at scale. National surveys like the National Survey of Student Engagement (NSSE) gather standardized data on student behaviors, like time spent on coursework and interactions with faculty. This helps identify campus-wide trends. You can discover more about these large-scale assessment strategies to see how they can work alongside your own classroom-level efforts.
To help you navigate the options, here’s a look at some popular survey tools and what they’re best suited for.
Comparison of Major Student Engagement Survey Tools
A comprehensive comparison of popular engagement measurement tools, their features, and best use cases
This table shows there’s a tool for nearly every need, from a quick classroom poll with Google Forms to a deep institutional dive with NSSE or Qualtrics.
Beyond Traditional Surveys: Innovative Feedback Tools
Feedback collection isn't limited to static forms anymore. Imagine embedding quick-check questions directly into your lesson videos. This simple change transforms passive viewing into an active learning experience, giving you instant data on who is watching and what they understand. It’s a powerful method that takes cues from successful digital marketing. Our guide on using interactive video for engagement offers some fantastic ideas that are easily adapted for an educational setting.
Visualizing the data you gather is key to spotting meaningful patterns. This chart, for example, compares metrics like participation, assignment submission, and time on task.
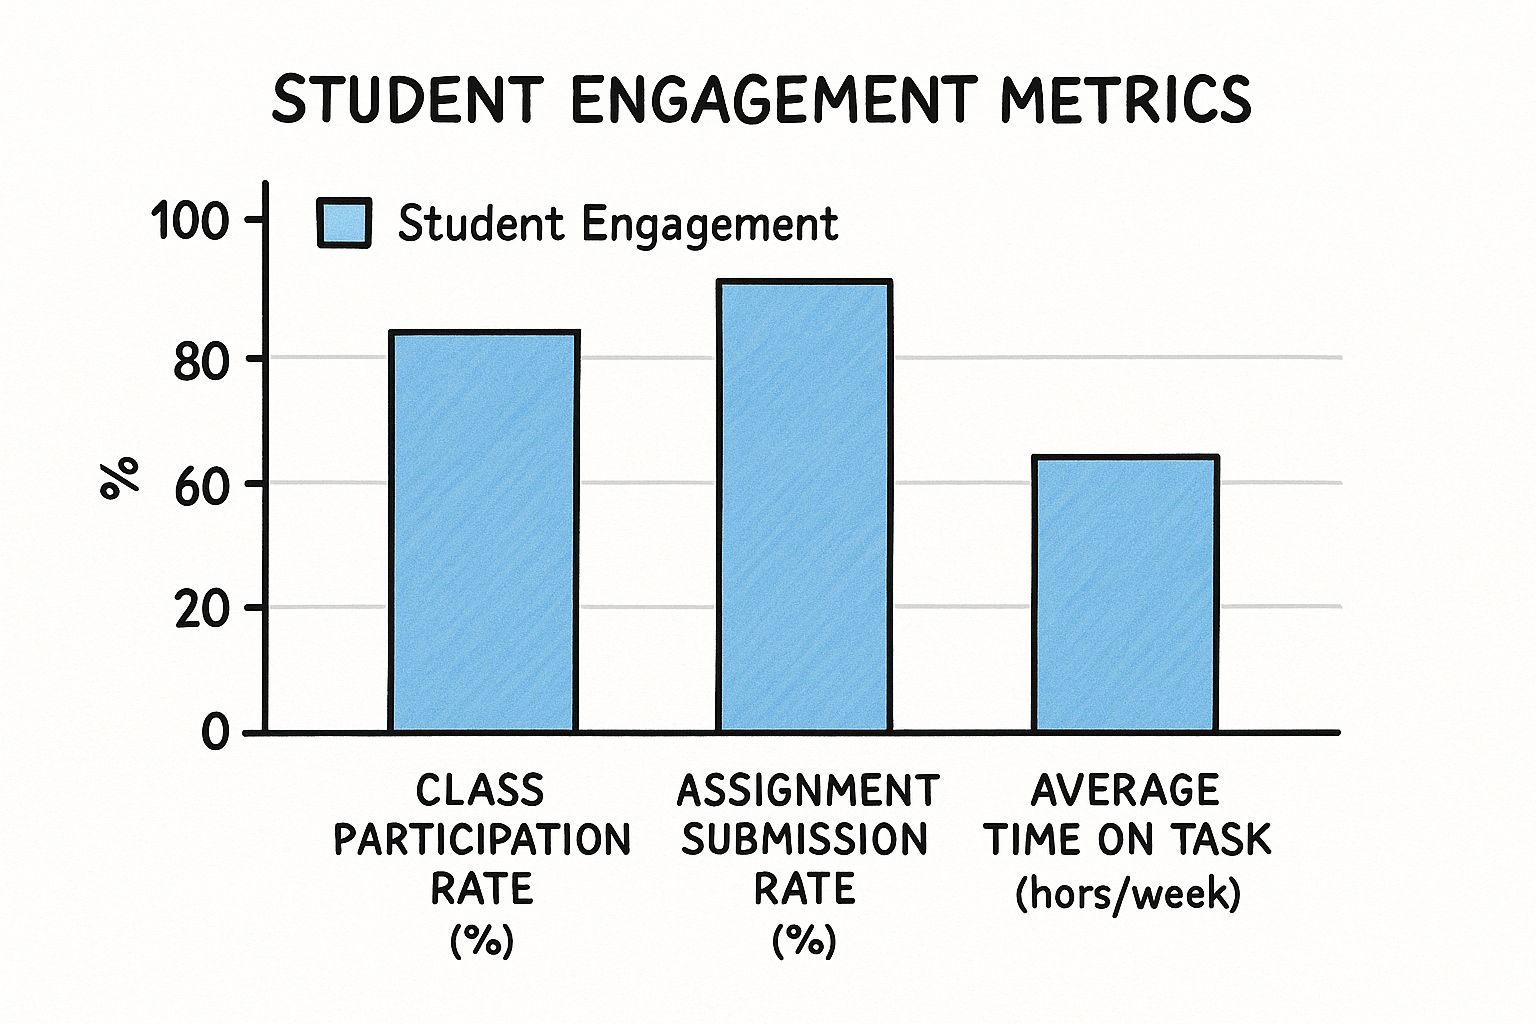
A quick glance at this visual makes it clear: while assignment submission is high, active participation and time on task are falling behind. This immediately points to a potential gap in cognitive or emotional engagement that you might not have noticed otherwise.
Mining Gold From Your Digital Learning Data
 Beyond what you see in the classroom or hear in surveys, there’s a massive source of engagement insight probably sitting right at your fingertips: your digital learning tools. Your Learning Management System (LMS) isn't just a digital filing cabinet for assignments; it's a breadcrumb trail showing exactly how students interact with your course. Think of it as mining for gold. The data is the raw ore, and with the right approach, you can extract some incredibly valuable insights.
But staring at a dashboard full of numbers can be overwhelming. The secret is knowing which metrics actually tell a story about student engagement. Instead of getting lost tracking every single click, the best educators look for patterns that signal meaningful behavior.
Decoding Key LMS Metrics
So, where should you start digging? Focus on data that reflects active, thoughtful participation rather than just passive access. I’ve found a few key metrics are especially powerful for understanding what’s really going on with your students' engagement.
- Content Interaction Patterns: Don't just check if a student logged in. Look at what they did next. Did they glance at a reading for 30 seconds, or did they spend 15 minutes on a page with an embedded video? Tools that show time-on-page or video completion rates are priceless here.
- Discussion Forum Quality: Go beyond just counting posts. Dig into the substance. Is a student simply posting "I agree" to check a box, or are they asking sharp questions and replying thoughtfully to their peers? This is the difference between compliance and genuine cognitive engagement.
- Assignment Submission Timelines: A student who consistently turns in work just minutes before the deadline might be struggling with time management or motivation. Catching this pattern early gives you a chance to step in before they fall too far behind.
Modern tools have certainly made it easier to measure student engagement with hard numbers. The analytics in your LMS are a great example, tracking how often students access materials, participate in discussions, and submit work on time. These give you clear behavioral clues. You can read more about how institutions quantify digital engagement to get some additional ideas.
From Data Points to Actionable Insights
The goal isn’t to become a data scientist overnight. It’s about using this information to support your students. For instance, a history teacher I know noticed two students hadn't accessed the materials for an upcoming project. She sent a quick, non-judgmental check-in email. It turned out one was home sick and the other was confused about the project's requirements—both problems she could solve right away.
You can often set up automated alerts in your LMS to flag students who haven't logged in for a few days or who bomb an initial knowledge-check quiz. This proactive approach turns data into a safety net, helping you catch disengagement before it spirals. When you combine these digital metrics with what you observe in class, you get a complete, three-dimensional picture of each student's learning journey.
Reading the Room: Observation Techniques That Work

While digital tools and surveys give you solid quantitative data, some of the most powerful insights on how to measure student engagement come from the oldest method around: intentional observation. This isn't just a quick scan of the room. It’s about becoming a skilled reader of your students' subtle signals. When you develop a keen eye, you can piece together a much richer story of engagement that numbers alone just can’t tell.
Veteran educators will tell you that engagement isn’t always loud. In fact, some of the most focused students are the quiet thinkers. The real skill is looking for specific indicators that go beyond just a raised hand.
Creating a Simple Observation Protocol
You don't need an elaborate system to make observation effective. A simple protocol can add structure to your "reading of the room" without messing with your teaching rhythm. A great way to start is by focusing on a few students each day, jotting down quick notes on a checklist or even just a stack of sticky notes.
Try to track a mix of verbal and non-verbal cues. Here are a few things to look for:
- Body Language: Are students leaning in, making eye contact, and nodding? Or are they slumped over, doodling, or constantly glancing at the clock? In a virtual class, this might be the difference between a student looking at the camera versus their eyes darting all over their room.
- Participation Style: Make a note of who asks clarifying questions, who builds on a peer's comment, and who offers a thoughtful (but opposing) view. Remember that a student who is actively and intently listening is also participating.
- Task Persistence: When a student hits a tough problem, do they give up right away, or do they experiment with different ways to solve it? This is a huge indicator of cognitive engagement.
Interpreting What You See
It's so important to learn the difference between deep thinking and disengagement. A student staring off into space might be wrestling with a complex idea, not just zoning out. A good way to find out is to follow up with a gentle, open-ended question like, "What are your thoughts on that?" Their answer will usually reveal their level of cognitive involvement pretty quickly.
For instance, during a group project, I once saw a student sitting back silently while the others were actively talking. My first instinct was to mark him as disengaged. But when I checked in, I found he had been sketching a complete mind map of their conversation, organizing everyone's ideas into a coherent plan. He was quietly leading the group.
These are the kinds of observations that, when documented consistently, add the qualitative context you need. They help you truly understand the data from your LMS and surveys, giving you a complete picture of student connection.
Creating Meaningful Feedback Partnerships With Students
The most insightful data on student engagement won’t come from a dashboard or a formal survey. It comes from treating your students as active partners in their own learning. The best way to measure student engagement is to build it directly into the fabric of your classroom dialogue. This changes the dynamic from you studying them to both of you working together to make the learning experience better for everyone. This isn’t about a dusty suggestion box used once a semester; it’s about creating a continuous, two-way conversation.
Educators who are ahead of the curve are already doing this. They build trust by showing students that their feedback leads to real, visible changes in the classroom. This turns what could be a chore—data collection—into a valued, collaborative effort.
Asking the Right Questions to Open Dialogue
The secret to a successful feedback partnership is asking questions that invite honest, thoughtful responses, not just one-word answers. It’s about fostering a safe space where students feel comfortable sharing their struggles and successes without worrying about being judged.
Instead of a generic "Did you like the activity?" try digging deeper with more specific, open-ended questions like:
- "What was the most confusing part of today's lesson?"
- "At what point during the project did you feel most engaged, and what was happening then?"
- "If you could change one thing about how we review for tests, what would it be and why?"
Questions like these show you genuinely care about their learning journey, not just their final grade. They give you rich, qualitative insights that raw numbers can never provide. According to a 2024 Walton Family Foundation-Gallup survey, a major reason students feel engaged is when a teacher makes a subject interesting. Asking for their input on how to do that is a direct path to boosting that very engagement.
Practical Strategies for Building Feedback Partnerships
Weaving these feedback loops into your routine doesn't have to be a major overhaul. Simple, consistent practices can make a huge difference in opening up communication and getting actionable ideas.
To help you choose the right approach, here's a look at a few common methods and how they stack up in a real-world classroom setting.
Student Feedback Collection Methods and Effectiveness
Analysis of different feedback collection approaches and their impact on student engagement improvement
This table shows that even low-effort methods like Exit Tickets can have a high impact by providing immediate feedback. For deeper, more reflective insights, Reflection Journals are excellent, though they require a bit more effort to manage.
Learning to handle criticism is part of this journey. When a student offers a tough but fair critique, thank them for their honesty. If you can, act on their suggestion, even if it's a small adjustment. This simple act proves you’re listening and builds the trust required for a true partnership. Ultimately, it transforms engagement measurement from a task into a constructive, ongoing dialogue that helps everyone succeed.
Turning Data Into Action That Makes a Difference
Collecting a mountain of data on student engagement feels productive, but it’s really just the starting point. The real magic happens when you translate those numbers and observations into actual changes in your classroom. This is where you go from just knowing how to measure student engagement to actively improving it. The aim isn't to build complicated reports, but to spot patterns that tell a human story about each student's learning journey.
Think of yourself as a learning detective. Your learning management system (LMS) analytics might show a student consistently logs in late at night. Your own observation notes might mention they seem tired in class. A quick survey reveals they feel overwhelmed. On their own, these are just data points. But when you put them together, they paint a clear picture of a student who could use some support.
From Insights to Interventions
Once you’ve spotted a pattern—like a noticeable dip in discussion forum participation right after you introduce a tricky new topic—it’s time to plan a small, targeted intervention. You don’t have to overhaul your entire curriculum. Meaningful action is often simple and direct.
Here are a few real-world examples of how this could look:
- The Insight: Your data shows very low completion rates on an instructional video you assigned.
- The Action: Add an interactive question using a tool like Mindstamp midway through the video. This can re-engage viewers who have tuned out and give you a quick check for understanding.
- The Insight: Exit tickets from Friday's class reveal that several students are confused about the same key concept.
- The Action: Kick off the next class with a quick, hands-on review activity that directly addresses that specific point of confusion.
- The Insight: Your observation notes show that a few quiet students never speak up during large group discussions.
- The Action: Introduce a "Think-Pair-Share" activity. This gives them a chance to articulate their thoughts in a lower-stakes, one-on-one setting before sharing with the whole class.
Measuring What Matters: Is It Working?
The final, critical piece of the puzzle is to measure whether your intervention actually made a difference. This creates a powerful feedback loop that fuels continuous improvement. If you tweaked a project based on student feedback, follow up with another quick poll. Did their sense of ownership increase? Did they find the new version more engaging? This method mirrors effective strategies used in professional training; you can learn more about how to measure the effectiveness of your efforts in a similar context.
The most successful educators I know build manageable tracking systems that don’t become another administrative burden. A simple spreadsheet or a digital notebook is often all you need to jot down an issue, the action you took, and the result. To effectively turn data into a solid plan, it's useful to look at broader strategies for sparking interest, like those covered in these Audience Engagement Strategies: A Modern Playbook For Real Results. This process transforms data from a static report into a dynamic tool for creating positive, lasting change in your classroom.
Your Personal Engagement Measurement Action Plan
It’s time to shift from just talking about measuring student engagement to actually doing it. The most important part of this whole process is creating a practical, personalized system that works for you. The secret isn't to try and implement every single idea at once—that’s a surefire way to get overwhelmed.
Instead, your initial goal should be consistency, not perfection. A simple, focused plan that you can stick with will give you much more valuable information over time than a super-ambitious strategy you drop after a couple of weeks.
Your First 30 Days: A Realistic Start
Let's put together a straightforward, effective plan for the next month. This approach is all about getting you useful data without adding a ton of work to your plate. Forget about mastering every single technique; just focus on getting comfortable with one or two.
- Week 1: Choose Your Focus Metric. Start by selecting just one metric to track. Will it be behavioral, like checking assignment submission times in your LMS? Or maybe emotional, like a weekly one-question "vibe check" poll? You could even go cognitive by tracking the kinds of questions students ask during class. The key is to just pick one.
- Weeks 2-3: Gather Baseline Data. For the next two weeks, consistently track your chosen metric. You don't need fancy tools; a simple spreadsheet or even a dedicated notebook will do the job. The goal here is just to observe and record what's happening without making any changes. This process establishes your baseline.
- Week 4: Introduce One Small Intervention. Look at the data you've gathered. Based on what you see, make one small, deliberate change. For example, if you noticed students seem hesitant to start a big project, you could introduce a "Think-Pair-Share" activity to get the ball rolling on the next one.
Building Momentum and Troubleshooting
After your first month, you'll have a solid foundation of data to build on. From this point, you can start to slowly layer in other measurement methods. You might add some qualitative observation notes to add context to your quantitative data.
Remember, this is a long-term strategy, not a race. Celebrate the small wins! When a usually quiet student speaks up because of a new activity you tried, that's a huge success. These moments provide the fuel to keep refining your approach.
To make your data collection even smoother, think about how technology can lend a hand. For example, using a platform like Mindstamp to embed questions directly into your instructional videos can turn passive viewing into an active measurement opportunity. This gives you rich engagement data without creating extra work for you or your students.
Ready to see how interactive video can change how you measure engagement? Explore Mindstamp today and start turning your videos into powerful data-gathering tools.
Get Started Now
Mindstamp is easy to use, incredibly capable, and supported by an amazing team. Join us!


Try Mindstamp Free


