
Master Content Engagement Metrics to Boost Your Results


Understanding What Content Engagement Metrics Really Mean
 Think of content engagement metrics as the vital signs for your content's health. While traditional metrics like impressions tell you how many people might have seen your content, engagement metrics reveal something much more important: whether they actually cared. They are the digital version of a reader nodding along, a customer leaning in to hear more, or a student raising their hand with a question. These metrics measure the quality of the bond between your audience and your content, shifting the focus from simply gathering eyeballs to sparking genuine interaction.
This marks a significant change in how successful creators measure their work. Instead of chasing massive, yet often passive, audiences, the goal is to cultivate a smaller, more dedicated community that actively participates. A high view count means very little if no one clicks, comments, or shares. True success is found in the actions your audience takes after they see your content, as these behaviors signal a much deeper level of interest.
From Impressions to Interactions
Imagine you're a street musician. An impression is someone walking past your stage. An engagement is when they stop, listen, and start tapping their foot to the beat. This difference is critical. The marketing world agrees; a 2019 survey of 301 marketing professionals identified 'engagement'—covering likes, shares, and time spent—as a top measure of content success. You can find more details from this content marketing survey to see how experts weigh these metrics.
Focusing on interaction turns your analytics from a simple scoreboard into a strategic guide. By analyzing how people interact, you can:
- Pinpoint the topics that truly connect with your audience.
- Discover which formats (like video, articles, or interactive elements) perform best.
- Identify parts of your message that might be unclear or uninteresting.
Why Engagement Data Is Your Roadmap
Ultimately, tracking the right content engagement metrics helps you build real relationships. When you understand what sparks curiosity and what causes confusion, you can fine-tune your strategy to provide more value. This creates a powerful feedback loop: better content drives higher engagement, which gives you clearer data, which then helps you create even better content. To put these ideas into practice, it's worth learning how to measure content engagement with specific strategies. Learning to see beyond surface-level numbers is the first step toward lasting content success.
The Core Content Engagement Metrics That Drive Success
To figure out if your content is truly connecting with people, you need to look beyond simple views. Certain metrics act as a compass, pointing to genuine audience interaction. These are the content engagement metrics that reveal how deeply your audience is invested in what you've created, and they are strong predictors of your overall success.
This isn't just a fleeting trend; it's a fundamental shift in how professionals measure what works. A 2024 survey of over 1,000 marketing professionals found that social media and website interactions are their top measures of content performance. In fact, 53% of marketers track social media engagement, and another 53% monitor website engagement to understand their impact. You can read more about these key content marketing benchmarks to see how industry leaders are evaluating their efforts.
To help you navigate these metrics, the following table breaks down the most common ones tracked by marketers, showing how widely they're used and what they're best for.
This table shows that while a majority of marketers are focused on top-of-funnel engagement, a significant number also connect their content directly to leads and sales. A balanced approach means tracking metrics across the entire customer journey.
On-Site Engagement: The Digital Handshake
On-site metrics show you what happens the moment someone arrives on your website. Think of it like a digital handshake—it signals initial interest and a desire to connect. Watching these numbers tells you if your content is hitting the mark.
Key metrics to watch include:
- Average Time on Page: This is a straightforward measure of how long visitors are sticking around. A longer time on page usually means your content is compelling and delivers on its promise.
- Bounce Rate: This is the percentage of visitors who leave your site after viewing only a single page. A high bounce rate could mean your content didn't match their expectations or that the page was difficult to use.
- Pages per Session: Are visitors curious enough to click through to other pages on your site? A higher number here is a great sign that they find your content valuable and want to see more.
Off-Site Engagement: The Social Megaphone
Off-site metrics, which mostly live on social media platforms, show how your content spreads and generates discussion online. These actions act like a megaphone, amplifying your message and helping you build a community.
Essential metrics here are:
- Shares: When someone shares your content, they're giving it a personal recommendation to their own network. This is one of the strongest signals that your content provides real value.
- Comments: Comments are a direct line to your audience. They provide rich, qualitative feedback and foster a sense of community around your brand.
- Click-Through Rate (CTR): This metric tells you how many people saw your social media post and were intrigued enough to click the link back to your website.
The infographic below shows how different types of content tend to perform across various engagement metrics.
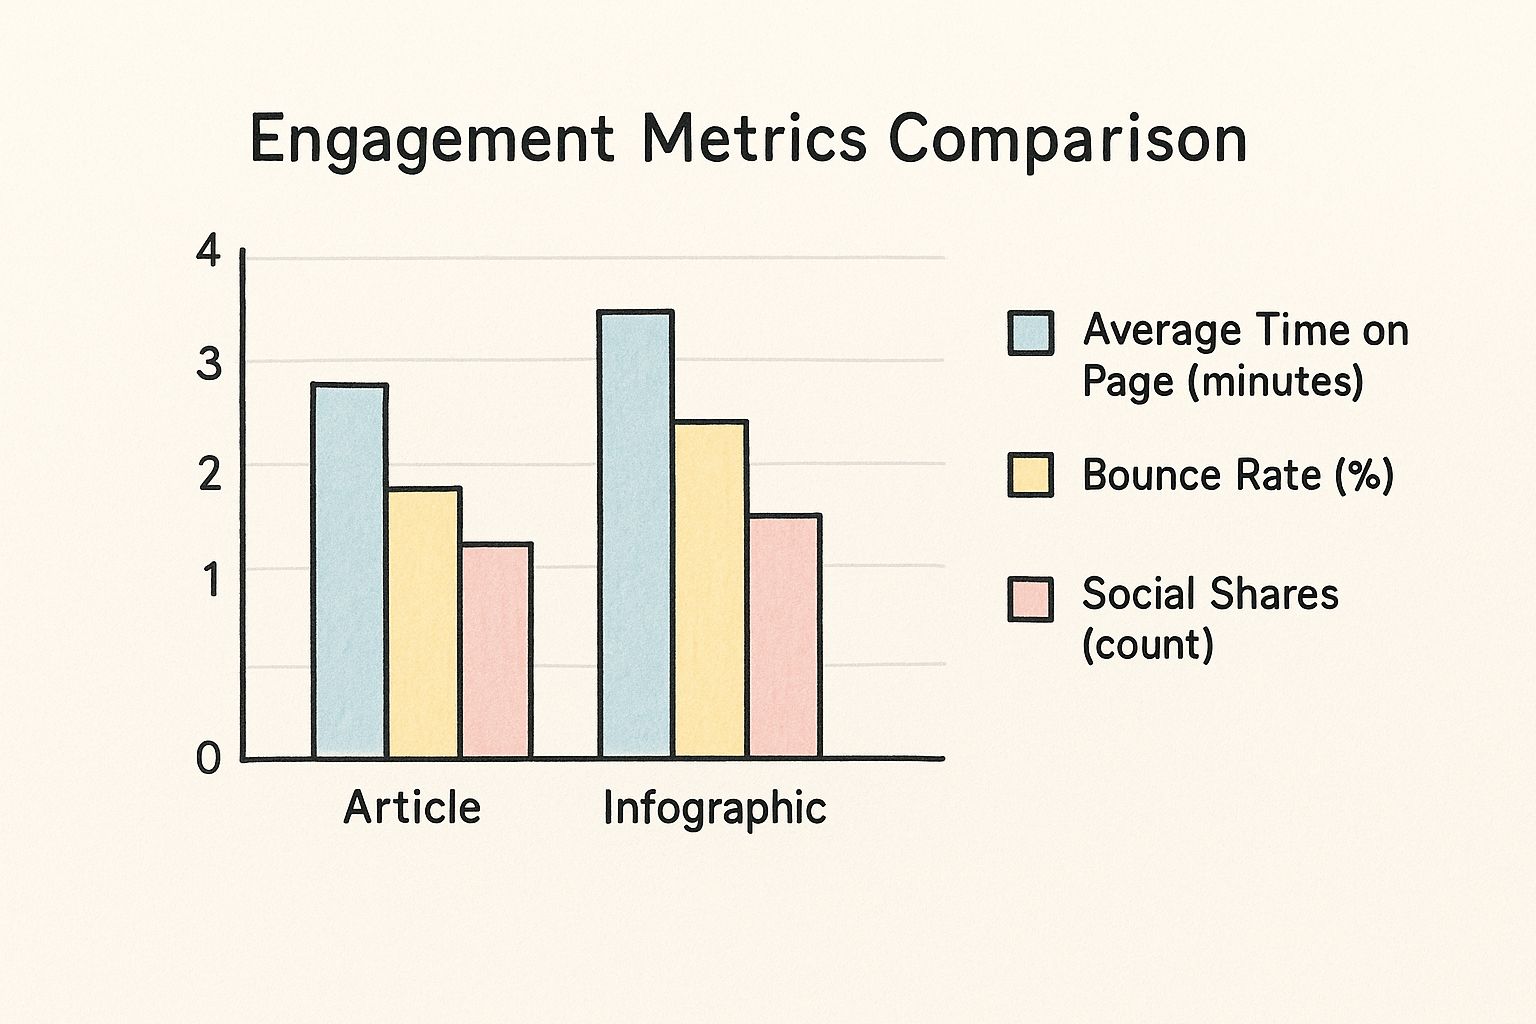
As the chart illustrates, some content formats are better at driving shares, while others might be better for generating clicks. This highlights why a well-rounded content strategy that uses multiple formats is so important.
When it comes to video, these interactions get even more interesting and specific. To learn more about this particular area, you might find our guide on key video engagement metrics helpful. By combining both on-site and off-site data, you can build a complete and accurate picture of your content's true impact.
Mastering Social Media Engagement In A Crowded Digital World
Social media platforms are no longer just digital town squares; they are giant arenas where countless pieces of content battle for a moment of your audience's time. To get genuine engagement in these packed spaces, you need more than just a "post and pray" strategy. Think of each platform—Instagram, LinkedIn, X, TikTok—as a distinct cultural event. The formal, buttoned-up approach that works at a professional conference (LinkedIn) would feel out of place at a high-energy music festival (TikTok).
Success comes from understanding these unique environments and tailoring your approach to the specific behaviors and expectations of each audience. This is critical when you consider the sheer scale of social media use. As of early 2025, the number of active users shot past 5 billion people, which is about 63.9% of the world's population. These users spend an average of 2 hours and 21 minutes scrolling every single day, creating a constant flood of content. You can discover more about these global social media trends to get a better sense of the competition. This nonstop activity has taught platform algorithms to reward content that truly holds attention, not just what gathers quick, superficial likes.
Why Time and Interaction Outweigh Likes
In this attention-based economy, metrics like watch time, saves, and thoughtful comments carry far more weight than simple likes or shares. A like is a fleeting nod of approval, but a save says, "This is so helpful, I need to come back to it." A detailed comment shows your content started a real conversation. These deeper interactions are powerful signals to algorithms that your content is valuable and should be shown to a wider audience.
Practical Techniques for Standing Out
To improve your social media performance, shift your focus from content that people passively consume to content that encourages them to actively participate. Try these approaches:
- Ask Open-Ended Questions: Don't just broadcast information. Prompt your followers to share their own stories, opinions, or experiences in the comments.
- Create "Saveable" Content: Design checklists, quick how-to guides, or insightful infographics. This kind of content provides lasting value, making users want to save it for later.
- Use Interactive Features: Take advantage of the tools built into the platforms, like polls, quizzes, and "ask me anything" sessions on Instagram Stories, to engage your audience directly.
By concentrating on these more meaningful content engagement metrics, you can build a more dedicated community and achieve much greater visibility. This strategy isn't just about playing to the algorithm; it's about creating real connections in a space where everyone is competing for a moment of authentic human attention.
Building Your Content Engagement Measurement Framework
Creating a system to track your content engagement metrics is like building a custom dashboard for a car. You wouldn't just install a speedometer; you'd want gauges for engine temperature, fuel efficiency, and tire pressure. This framework isn't just about plugging in analytics—it's about carefully selecting the right dials that tell you exactly what you need to know to reach your destination without breaking down. The goal is a system that delivers clear, actionable insights, not a flood of overwhelming data.
A successful framework gives you a single, unified view of performance, even when your audience interacts with your content across different platforms. It’s about creating a single source of truth for your content's impact.
Setting Up a Solid Foundation
The first step is establishing a baseline. Think of this as your starting point on a map. Before you can measure progress, you need to know where you are now. This means tracking your key metrics over a set period (like 30 or 90 days) to understand what "normal" looks like for you. This initial data helps you set realistic, achievable targets. For example, if your average time on page is 54 seconds, a reasonable first goal might be to increase it to 70 seconds, not to leap to five minutes overnight.
A few common mistakes at this stage can poison your data from the very start. These include:
- Forgetting to Exclude Internal Traffic: Your own team visiting your website will skew the data. Make sure to filter out IP addresses from your company to keep your numbers clean.
- Inconsistent Naming Conventions: Using different names for the same campaign (like "SummerSale24" vs. "summer_sale_2024") splits your data and makes it nearly impossible to analyze performance accurately.
- Ignoring Privacy: Be transparent about what you track. Relying too heavily on invasive tracking methods can erode audience trust, which is the ultimate engagement killer.
From Data Points to Strategic Dashboards
Once your tracking is clean, it's time to organize your metrics into a dashboard that tells a story. This isn't just a data dump; it’s a curated report designed to answer your most important questions. A well-designed dashboard should connect directly to your content goals.
Here’s how you can align your dashboard with what you want to achieve:
By building this framework, you create a powerful feedback loop. Your dashboard shows what’s working, guiding you to create more effective content in the future. This consistent, organized approach to measurement is what separates creators who guess from those who grow their audience with intention and precision.
Turning Engagement Data Into Content Strategy Gold
 The numbers in your analytics reports tell you what happened, but the real value is in understanding why it happened. Think of your content engagement metrics as individual clues in a treasure hunt. By piecing them together, you can uncover the "gold": actionable insights that turn your content strategy from a guessing game into a reliable system for growth. It’s about shifting from just reporting on what worked yesterday to actively shaping what will work tomorrow.
A true analysis means finding the patterns that highlight your content’s secret weapons. By regularly reviewing your data, you can isolate the specific traits of your most successful pieces. For example, do you see that articles with interactive videos consistently get an average time on page that's 54 seconds longer? That single observation is pure strategy gold.
From Patterns to Predictions
Once you spot these winning characteristics, you can create a blueprint to repeat that success. This is the point where you connect audience engagement directly to business goals. Segmenting your audience based on how they interact with your content is a great way to start.
The Google Analytics dashboard below is an example of how you can visualize user engagement over time, which is the first step in discovering these patterns.
This chart doesn't just show total users; it reveals trends in engaged sessions. This lets you pinpoint which days or weeks generate the most valuable interactions. When you see these peaks, you can dig deeper to see which content or campaigns were responsible.
Mapping the Audience Journey
Grasping these patterns allows you to map out the typical path your audience takes. You can learn which blog post first grabs a visitor's attention, which video persuades them to stick around, and which case study ultimately leads to a conversion. This detailed view helps you build a more personalized experience. For instance, learning how interactive video drives CRM marketing success can give you a clear roadmap for converting passive viewers into qualified leads.
Your historical data effectively becomes a crystal ball. It helps you anticipate things like:
- Seasonal Fluctuations: You'll know the perfect time to launch campaigns for the biggest impact.
- Emerging Opportunities: You can identify new topics or formats that are gaining traction before everyone else does.
- Content Fatigue: You can recognize when a popular format is starting to lose its charm.
When you treat your content engagement metrics as a strategic guide instead of just a historical record, you can make smarter, data-backed decisions that consistently improve your content's performance.
Optimizing Content Based On What Your Audience Actually Wants
Turning engagement data into better content is where the real value appears. Think of a chef tasting a sauce and knowing it needs a little more salt—they aren't just guessing. By systematically looking at your content engagement metrics, you can stop guessing and start giving your audience exactly what they crave. This data-backed approach helps you move beyond simply making content and into a cycle of constant improvement.
Smart creators use this feedback to sharpen their strategy. They might find that blog posts published on Tuesday mornings get a 20% higher share rate, or that interactive videos hold attention much longer than static ones. These aren't just interesting facts; they are direct instructions from your audience on how to serve them better. This methodical refinement helps you do more of what works, making sure your efforts consistently deliver stronger results.
Creating Feedback Loops for Continuous Improvement
The heart of this optimization process is building a reliable feedback loop. This means you test ideas based on your engagement data and then measure what happens. It’s like running a small science experiment for your content.
Here are a few ways to build your own feedback loop:
- A/B Test Your Assumptions: Don't just hope a new headline will perform better—test it. Create two versions of an email or social media post and see which one gets a higher click-through rate.
- Optimize for Platform Algorithms: Each social platform has its own preferences. If your data shows that carousel posts on Instagram drive more saves and comments, it's a good idea to create more of them.
- Analyze Your Top Performers: Look closely at your most successful content. What do these pieces have in common? Is it the topic, format, tone, or call-to-action? Find those winning elements and use them again. For more ideas on improving performance, you can explore various strategies to increase client engagement and boost interaction.
To help you get started, here's a table outlining different ways to optimize your content based on the type of engagement you want to improve.
This table shows that even low-effort changes can have a significant impact on how your audience interacts with your content. The key is to match the right strategy to the specific metric you want to improve.
Balancing Data with Creative Intuition
While data tells you what is happening, your creative intuition helps you understand why. Metrics might show that videos with questions perform better, but your creativity is what helps you write questions that are truly interesting. For instance, knowing the importance of adding a CTA to videos comes from data, but designing a CTA that feels natural and compelling needs a human touch.
By mixing hard data with your creative instincts, you can produce content that not only performs well by the numbers but also feels genuine and connects with your audience. This balance is essential for building a loyal community that trusts your brand and keeps coming back for more.
Avoiding The Engagement Measurement Traps That Derail Success
Even the most seasoned content creators can stumble into measurement traps that lead to flawed strategies and wasted time. It’s easy to get lost in a sea of data, but knowing the common pitfalls is the first step toward using content engagement metrics effectively. Think of it like a pilot flying through a storm; they must trust their instruments but also know how to spot a false reading that could send them off course. Steering clear of these traps ensures your strategy fosters real growth, not just charts that look impressive.
The Siren Song of Vanity Metrics
The most common trap is becoming fixated on vanity metrics. These are numbers like total page views or social media likes that look great in a report but offer very little insight into genuine audience connection. A post with 10,000 likes might appear successful, but if it didn't generate any website clicks, comments, or new followers, its impact was shallow.
The real value is in metrics that signal a deeper investment from your audience. These include things like average session duration, the sentiment of comments, or conversion rates on a landing page. Chasing high-level numbers without considering their quality is a guaranteed way to misjudge your content’s actual performance.
Comparing Apples to Oranges
Another frequent mistake is comparing engagement metrics directly across different platforms. A 3% engagement rate on a professionally-focused platform like LinkedIn could be fantastic. However, that same 3% on a highly visual platform like Instagram might be considered average or even poor.
Each platform has its own unique user behaviors and algorithmic priorities. Lumping all your data together blurs these vital distinctions, making it impossible to see what is truly effective in each environment. You need to set different benchmarks and expectations for each channel to get a clear picture.
The Correlation vs. Causation Fallacy
Perhaps the most subtle trap is confusing correlation with causation. For instance, you might notice that blog posts published on Mondays receive more shares and conclude that Monday is the best day to post.
But what if you also happen to publish your most in-depth, well-researched articles on Mondays? The high share count is likely caused by the quality of the content (causation), not just the day of the week (correlation). Making strategic decisions based on a simple correlation without digging deeper can lead you to optimize for the wrong thing.
To maintain measurement integrity, always question your data. Ask "why" behind every trend you see. By setting realistic expectations and sidestepping these common traps, you can ensure your analysis of content engagement metrics leads to sustainable, meaningful growth.
Ready to move beyond basic metrics and see what truly captures your audience's attention? Discover how interactive video can transform your content strategy. Explore Mindstamp’s powerful analytics features today!
Get Started Now
Mindstamp is easy to use, incredibly capable, and supported by an amazing team. Join us!


Try Mindstamp Free


