

Master How to Calculate Retention Ratio Effectively


When you hear the term "retention ratio," it's easy to assume it means just one thing. But in reality, it's a bit of a chameleon. Depending on who you're talking to—an investor or a marketer—it can mean something completely different.
Think of it this way: one formula helps you understand your company's financial discipline, while the other reveals the strength of your customer relationships. Both are vital signs for your business, but they tell very different stories.
Understanding What Retention Ratio Really Means

The term "retention ratio" wears two very different hats, and knowing which one you’re dealing with is the first step toward any meaningful analysis.
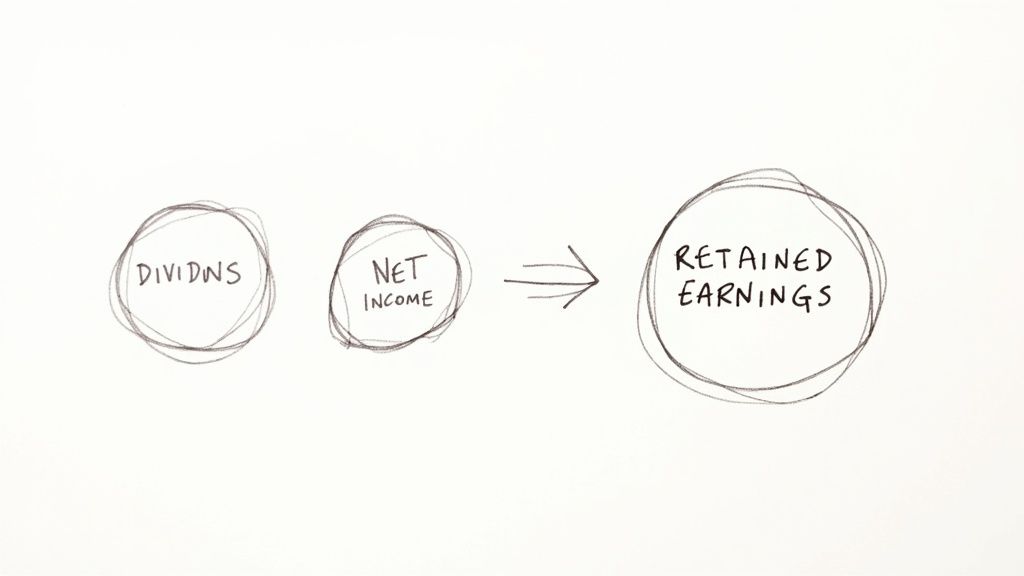
On one side, you have the financial retention ratio, which investors often call the plowback ratio. This is a big deal for them because it answers a simple but crucial question: Is the company reinvesting its profits to fuel future growth, or is it paying them out to shareholders as dividends? A high plowback ratio is a sign that a company is betting on itself, pouring money back into operations, R&D, or expansion.
Then there's the customer retention rate. For marketers, sales teams, and product managers, this metric is everything. It’s a direct measure of how good you are at keeping your customers happy and engaged over time. High customer retention points to strong product-market fit, great customer service, and a business model that actually works. After all, it’s almost always cheaper to keep a customer than to find a new one.
The Two Faces of Retention Ratios
Before you can calculate a retention ratio, you have to know which one you're trying to solve for. They serve different purposes and speak to different audiences within and outside your business.
This table gives a quick comparison of the two essential retention metrics every business leader should know.
Knowing the distinction is key. One informs your capital allocation strategy, while the other drives your customer experience and marketing efforts.
Formulas and Core Concepts
Calculating the financial retention ratio is pretty straightforward. You just divide the retained earnings by the total net income for a given period. It gives investors a clear look at a company's commitment to reinvesting in its own growth.
For operators focused on loyalty, the formula is different but just as crucial. It involves tracking your customer base over a specific timeframe to see who remains a customer.
Both calculations produce a single, powerful number that tells a core truth about your business—whether it’s about financial discipline or the ability to create lasting value for customers. Getting a handle on other key video engagement metrics can also provide a fuller picture of how your audience interacts with your brand.
The real power isn't just in the calculation itself, but in what you do with the result. A single number can spark critical conversations about growth strategy, customer satisfaction, and long-term financial planning.
A Practical Guide to Calculating Customer Retention
Theory is great, but the real work starts when you roll up your sleeves and actually calculate your customer retention rate. It’s a surprisingly straightforward metric, but one that gives you immense clarity on how loyal your customers are and how "sticky" your product is.
Let's walk through a real-world scenario to make this concrete.
Imagine you run a subscription box service. At the start of the quarter, let's say January 1st, you have 2,000 active subscribers. This is your starting line.
Over the next three months, your marketing kicks into gear and you bring in 300 new subscribers. By the end of the quarter on March 31st, after accounting for new sign-ups and some cancellations, your total subscriber count stands at 2,150.
Now we have all the pieces of the puzzle.
The Core Formula for Retention
The most reliable way to calculate retention is by focusing only on the original group of customers you started with. This is key because it stops new acquisitions from inflating your numbers and gives you a pure, unfiltered look at loyalty.
Here’s the standard formula:
Customer Retention Rate = [(Customers at End of Period - New Customers Acquired) / Customers at Start of Period] × 100
Using our subscription box example:
- Customers at End (E): 2,150
- New Customers (N): 300
- Customers at Start (S): 2,000
The math looks like this: [(2,150 - 300) / 2,000] * 100.
This simplifies to [1,850 / 2,000] * 100, which gives you a customer retention rate of 92.5% for the quarter.
So, what does that 92.5% really tell you? It's a powerful story. It means that of the original 2,000 subscribers you had on day one, you successfully kept 1,850 of them. The other 150 churned, or canceled their subscription, during that time.
This is the number that truly reflects how well you're keeping your existing customer base happy.
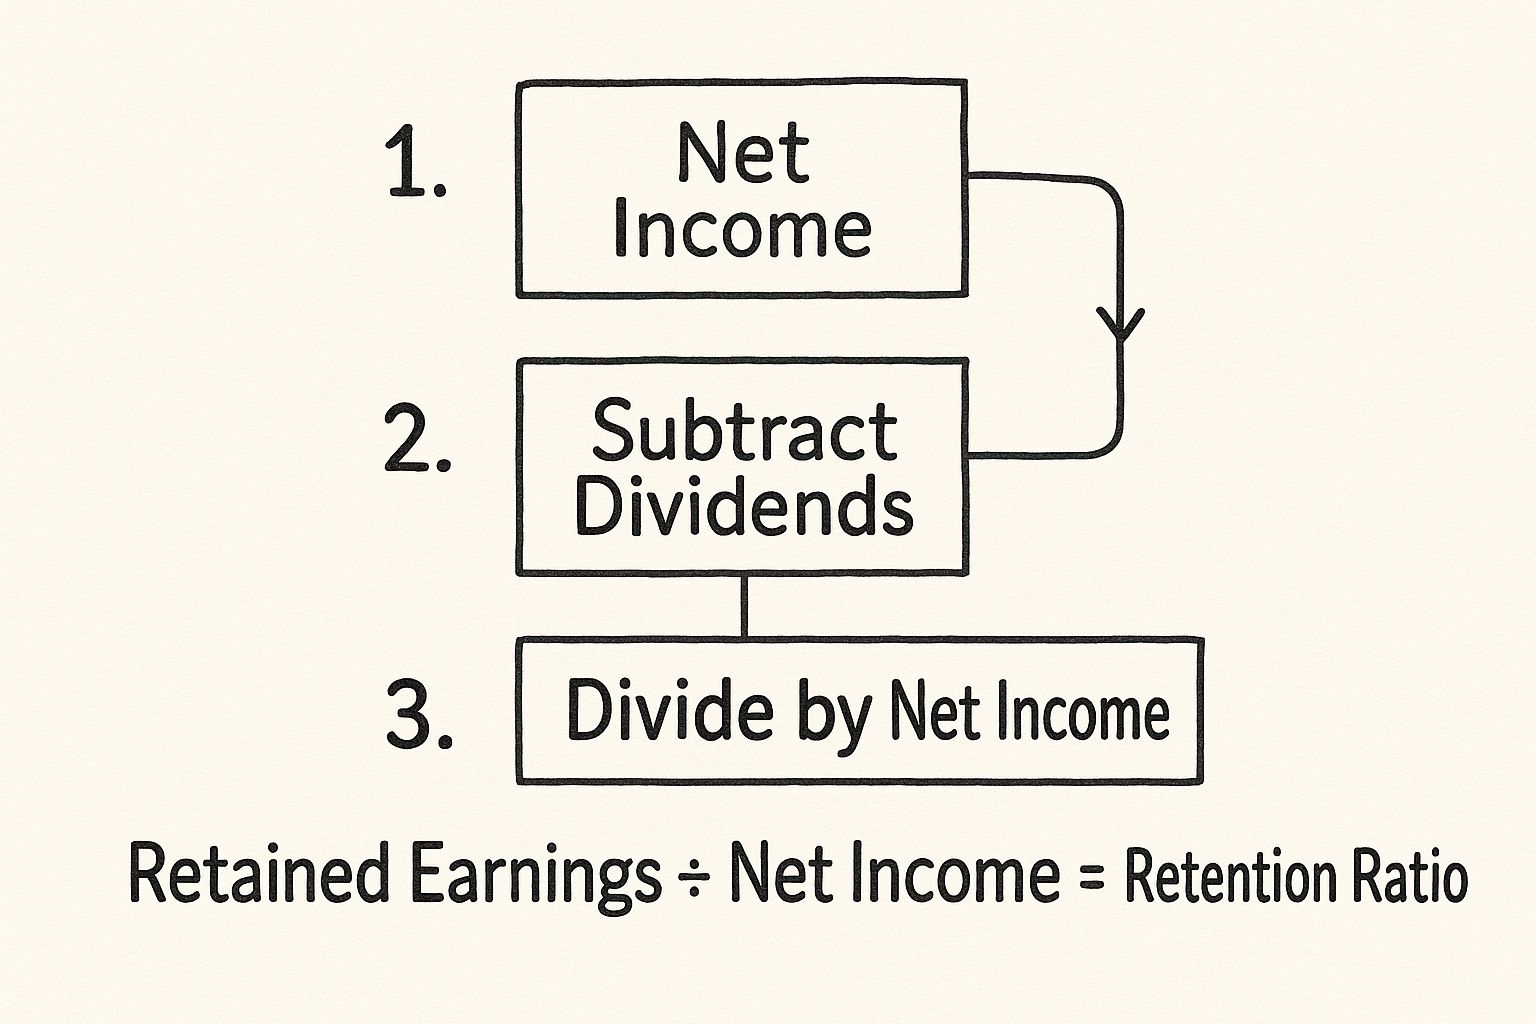
While the graphic above is geared toward financial retention, the core principle is identical: start with a whole number, isolate what's new, and see what remains.
Defining Your Time Period
Choosing your timeframe—be it monthly, quarterly, or annually—isn't just a small detail. It fundamentally shapes the story your data tells.
For a fast-moving SaaS business, a monthly calculation might be critical for spotting problems early. On the other hand, a service with long-term contracts might find an annual rate more meaningful.
The most important thing? Consistency.
Calculating your retention rate over the same period, every period, is how you spot trends. Is your rate inching up, dropping, or holding steady? That trend line is often far more insightful than any single, isolated number.
For a deeper dive into the nitty-gritty of the calculation, check out this complete guide to the customer retention rate formula. Once you have this number in hand, you can start making smarter decisions that directly boost customer loyalty and your business's overall health.
Advanced Retention Metrics for SaaS Businesses
When you're running a business with a recurring revenue model, like most SaaS companies, just counting the number of customers you keep doesn't give you the full story. You really need to follow the money.
This is where more sophisticated metrics come into play, specifically Gross Revenue Retention (GRR) and Net Revenue Retention (NRR). They're essential for getting a true read on the health of your subscription business.
Think about it: a standard customer retention rate tells you how many customers stick around. But GRR and NRR tell you how much revenue you're keeping from them. That's a critical difference. Losing a high-value enterprise client hurts way more than losing a user on your most basic plan.
Gross Revenue Retention: The Purest Test of Stickiness
If you want an honest, no-fluff metric, look at Gross Revenue Retention (GRR). It purely measures your ability to hold onto revenue from your existing customers, completely ignoring any upgrades or expansion revenue. I like to think of it as the ultimate test of your product’s core value.
The formula zeroes in on the revenue from your starting customer group and only deducts revenue lost from churn or downgrades. It intentionally leaves out any new revenue from those same customers, giving you a clean, unfiltered look at how sticky your product really is. A high GRR is a great sign that customers find your service valuable enough to keep paying for it, period.
The team at ChartMogul has a fantastic breakdown of how to calculate it.
As you can see, the calculation isolates your starting monthly recurring revenue (MRR), subtracts the losses from both churn and plan contractions, and then divides that by your starting MRR. Simple, but powerful.
Net Revenue Retention: Your Growth Engine
Net Revenue Retention (NRR) takes the analysis to the next level. It uses the same starting revenue base as GRR but then adds back any expansion revenue you've generated from that same customer cohort. This includes all your upsells, cross-sells, and even revenue from pricing increases.
NRR answers a really powerful question: can your business grow even if you don't sign a single new customer?
When your NRR is above 100%, you’ve hit a milestone called "negative churn." This is the holy grail for SaaS—it means the revenue you're gaining from existing customers is more than offsetting the revenue you're losing from churn. It’s a huge signal of a healthy, scalable business model.
A company with high NRR but low GRR might be masking a churn problem. It shows they are good at upselling the customers who stay, but they may be failing to retain a stable customer base in the first place.
This dynamic is something we see all the time in the Software as a Service world. For instance, a company might retain only 75% of its customers, but because the remaining customers upgraded their plans, their Net Revenue Retention could hit 103.9%.
Meanwhile, their Gross Revenue Retention, which ignores those upgrades, would tell a different story, sitting lower at 81.8%. You can dig into more SaaS retention benchmarks in this in-depth report. This is exactly why you need to track both metrics to get the complete picture.
What a Good Retention Rate Actually Looks Like
So, you've crunched the numbers and have your video retention rate. The very next question that pops into everyone's head is always, "Okay... but is this good?"
Honestly, a "good" retention rate isn't a one-size-fits-all number. It's incredibly contextual. The right figure for your business depends heavily on your industry, your business model, and even how long you've been around.
A rate that would have an e-commerce brand popping champagne could spell disaster for a B2B SaaS company. For example, businesses in finance or government tend to see stickier customers, while industries like hospitality and food service naturally have more turnover.
A lot of companies shoot for a customer retention rate of 90% or higher, which means a churn rate of 10% or less. But think of this as a general landmark, not a hard-and-fast rule you have to live by.
The real magic happens when you stop obsessing over a single number and start looking at industry-specific benchmarks. This gives you the context you need to set realistic goals and see how you're really doing against competitors chasing the same audience.
Benchmarks Across Different Industries
Putting your retention rate side-by-side with industry averages gives you a much clearer, more honest picture of your performance. It's the quickest way to know if you're leading the pack or if you've got some ground to make up.
Here’s a rough sketch of what you might see:
- SaaS & Software: B2B SaaS companies are often aiming high, with customer retention rates between 92%-97%. This makes sense—high switching costs and being deeply embedded in a client's daily workflow makes customers think twice before leaving.
- E-commerce & Retail: This space is a different beast entirely, with an average retention rate hovering around 63%. Loyalty is a tough game when Amazon and other competitors are just a click away.
- Financial Services: This sector usually boasts strong retention, often clearing 84%. Trust is a huge factor here, as is the sheer hassle people associate with switching banks or investment firms.
Understanding these nuances is everything. If your e-commerce store is hitting a 70% retention rate, you're not just doing okay—you're actually outperforming the average for your field.
Why Trends Matter More Than Snapshots
While benchmarks provide fantastic context, the single most important comparison you can make is against your own past performance. A single data point is just a moment in time. The trend is what tells the real story.
Is your retention rate ticking up, even slightly, quarter over quarter? That's a huge win. It’s a clear sign that your product updates and customer success efforts are paying off.
On the flip side, a high retention rate that's slowly but surely dropping is a massive red flag. It’s a leading indicator of future trouble, giving you a chance to intervene before churn really starts to pick up speed.
This is exactly what savvy investors look at. They want to see a positive trajectory because it signals a healthy, strengthening business with a loyal following. A compelling retention story can directly influence your company's valuation and make you much more attractive for future funding. To get your numbers trending in the right direction, check out these 5 tips for increasing video audience retention.
Actionable Strategies to Improve Customer Retention
Knowing how to calculate retention ratio is one thing, but the real magic happens when you start improving it. Moving from analysis to action is where you turn all that data into dollars. The good news? You don't need a huge budget to convince your customers to stick around.
Honestly, the best retention strategies are all about small, consistent wins across the entire customer journey. It’s about showing value early and often, listening before you’re asked, and making your customers feel like you actually see them. Tiny changes here can snowball into massive gains in loyalty and revenue down the road.
Redesign Your Onboarding for Instant Value
First impressions are everything. Your onboarding process is, without a doubt, the most crucial phase for a new customer. A confusing or drawn-out setup is a one-way ticket to churn. Your single-minded goal should be getting users to their "aha!" moment—that spark when they truly get your product's value—as fast as humanly possible.
Ditch the generic product tour. Instead, create a personalized flow. Use the data you collected at sign-up to tailor the experience. If a user told you they joined to achieve a specific goal, your onboarding should be a straight line to showing them exactly how to do that.
Try breaking down complex features into bite-sized, manageable steps. This cuts down on the feeling of being overwhelmed and builds momentum, turning that initial flicker of curiosity into real, sustained engagement. To really take this to the next level, you should explore the benefits of investing in interactive video for training and onboarding, which can guide users in a much more dynamic and helpful way.
One of the biggest mistakes I see is businesses front-loading their onboarding with every single feature. Customers don't need to know everything at once. They just need to solve their immediate problem.
Build a Proactive Feedback System
Don't sit around waiting for customers to complain before you do something. Your most loyal customers are often the ones who feel like you're actually listening. Building a system to proactively ask for and act on feedback is an incredibly powerful retention tool.
Open up a genuine dialogue with your customers by implementing a few of these feedback channels:
- In-app surveys: Use short, targeted surveys right after a user completes a key action. Ask them about their experience while it's still fresh.
- Regular check-ins: For your high-value clients, have account managers schedule quick quarterly calls. The goal isn't to upsell; it's just to ask, "How can we help you be more successful?"
- Monitor user behavior: Use your analytics to spot early warning signs of disengagement, like a sudden drop in logins. This gives you a chance to reach out with helpful resources before they decide to leave for good.
Closing the feedback loop is non-negotiable. When a customer makes a suggestion and you actually implement it, let them know! This simple act proves their voice matters and can turn a passive user into an active partner in your product's journey.
For a deeper dive, there are many proven strategies to boost retention that can help you build these systems effectively. When you combine these tactics with a solid grasp of how to calculate retention ratio, you’re building a powerful engine for sustainable growth.
Once you’ve got your retention numbers crunched, a whole new set of questions usually starts to bubble up. This is where the real work begins—turning that raw data into a smart, actionable strategy. Let's walk through some of the most common questions I hear from people trying to make sense of their metrics.
A big one is always, "How often should I even be calculating retention ratio?" The honest answer? It really depends on your business. A fast-paced SaaS company might need to look at this monthly to spot trouble before it snowballs. On the other hand, a business built on long annual contracts could find a quarterly or even yearly check-in far more useful.
The magic isn't in the frequency; it’s all about consistency. Pick a schedule that makes sense for you and stick to it.
Retention Versus Churn
It’s surprisingly easy to get retention and churn tangled up, but they’re really just two sides of the same coin. Your churn rate is simply the inverse of your retention rate.
So, if your customer retention rate is a solid 90%, that means your churn rate is 10%. Retention focuses on the good news (who stayed), while churn shines a light on the bad (who left). You absolutely need both for a complete picture. Looking at them together gives you a much richer understanding of your customer base's stability than either metric can on its own.
Key Takeaway: Think of retention as your defense and churn as the opponent's score. You have to watch both to know how the game is going. A high retention rate is the goal, which by definition means you're aiming for a low churn rate.
Can Retention Exceed 100 Percent?
I get this question a lot, especially when we start talking about revenue retention. The answer is a huge yes! This is a powerful concept known as negative churn, and for any subscription business, it's the gold standard.
Negative churn happens when the new revenue from your existing customers—think upgrades, add-ons, or buying more seats—is greater than the revenue you lose from customers who cancel or downgrade.
When your Net Revenue Retention (NRR) climbs over 100%, it’s a game-changer. It means your business can actually grow even if you don't sign a single new customer. That’s a massive signal of a healthy, scalable product that your customers love and are willing to invest more in over time.
Ready to turn your videos into retention-boosting machines? Mindstamp makes it easy to add interactive elements that keep viewers engaged and provides the deep analytics you need to see what's working. Transform your passive content into an active experience by visiting https://mindstamp.com.
Get Started Now
Mindstamp is easy to use, incredibly capable, and supported by an amazing team. Join us!


Try Mindstamp Free


