

The Retention Ratio Formula: Your Guide to Smarter Corporate Training


In the world of corporate training, financial literacy is a critical skill. The retention ratio formula is a key metric that reveals a company's growth strategy, showing how much profit is reinvested into the business versus paid out to shareholders. Understanding this concept empowers your teams to make better, more strategic decisions.
The formula itself is straightforward: (Net Income - Dividends) ÷ Net Income.
Understanding The Retention Ratio Formula
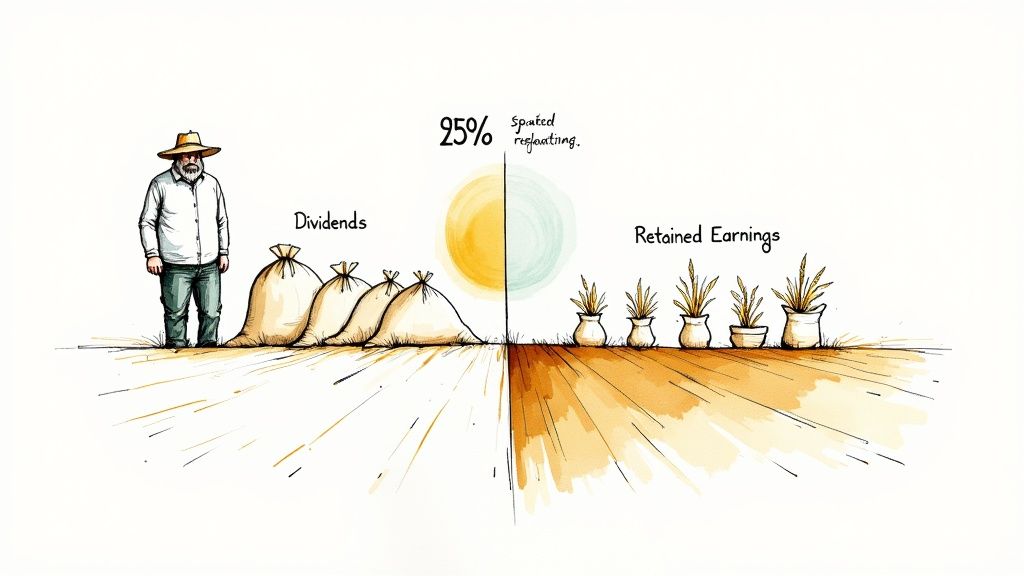
Think of a farmer after a successful harvest. They have a choice: sell all the grain for an immediate payout, or keep some of the best seeds to plant for an even bigger harvest next season. The retention ratio is the corporate finance version of that exact decision, a concept crucial for any training program focused on business acumen.
It all boils down to two key numbers from a company's financial statements: Net Income and Dividends. Analyzing these figures helps employees understand a company’s growth strategy.
- Net Income is the bottom-line profit—what’s left after all expenses, taxes, and other costs are paid.
- Dividends are the slice of that profit paid out directly to shareholders as a reward for their investment.
Calculating The Ratio
To get the ratio, you simply divide the earnings the company kept (retained earnings) by the total earnings it made. In formula terms, that’s (Net Income - Dividends) / Net Income.
Let's use a real-world example perfect for a training scenario. In 2020, Apple reported a net income of $57.4 billion and paid out $14.1 billion in dividends. When you plug those numbers into the formula, you get a retention ratio of about 75.5%. You can learn more about the specifics of the retention ratio on Wall Street Prep.
Why This Metric Matters for Training and Development
For leaders and L&D professionals, the retention ratio is more than just a number; it's a teaching tool. It helps focus training on what really matters: smart investment decisions and long-term strategy. Suddenly, a simple percentage transforms into a clear story about whether the company is prioritizing rapid growth or immediate shareholder rewards.
“Retention ratio reveals what portion of earnings powers future expansion.”
In a corporate training setting, this is where interactive video can make a huge impact. Instead of just showing the formula, embed a quick quiz where learners have to calculate the retention ratio themselves. This simple step dramatically increases engagement and, more importantly, knowledge retention.
- Better Analytics: Get instant feedback on how well your team is grasping the concept.
- Hands-on Practice: Let them simulate real-world financial choices in a safe, interactive training environment.
This foundational knowledge paves the way for deeper financial literacy. Next, we'll get into the weeds and calculate it step-by-step.
Key Factors To Remember in Your Training
Of course, the ratio doesn't exist in a vacuum. A few critical factors add important context that should be included in any training program:
- Time Horizon: A high retention ratio might not show immediate results, but its effect on growth can be massive over several years.
- Industry Context: What's considered a "good" ratio varies wildly between different sectors. A fast-growing tech company will look very different from a stable utility.
- Dividend Policy: The company's official policy signals its long-term strategy and how it balances reinvestment with shareholder payouts.
By embedding these factors into your training videos—say, with clickable hotspots that reveal industry-specific examples—you solidify the learning. It helps learners explore each factor in a relevant context.
Grasping these nuances helps teams apply the retention ratio formula thoughtfully. It elevates training videos from passive lectures to interactive labs for building real financial insight.
Tip: Use the branching logic feature in Mindstamp to quiz learners on each component of the formula as you cover it, ensuring they understand before moving on.
With this foundation, every team member can see the retention ratio formula as more than just an equation—it’s a story about where a business is investing its future. Let’s dive in.
How to Calculate the Retention Ratio Step by Step
Putting the retention ratio formula into practice is a core skill for any employee involved in financial decision-making. The math isn’t complex. The real skill, which can be honed through effective training, is in spotting the two numbers you need—Net Income and Dividends—on a company's financial statements.
To build this skill, it's a good idea to ensure your team knows how to read company financial statements inside and out. That knowledge is the foundation for any solid financial analysis and ensures you're not pulling the wrong data.
Let's walk through a quick example perfect for a hands-on training exercise.
A Practical Example Calculation
Imagine a fictional company called "Innovate Inc." for a training scenario. We want to find its retention ratio for the last fiscal year. First, we need its financial reports—specifically the Income Statement and the Statement of Cash Flows.
- Find Net Income: Head over to the Income Statement and look at the very bottom line. For our example, we'll say Innovate Inc. reported a Net Income of $2,000,000.
- Find Dividends Paid: This number usually lives on the Statement of Cash Flows, tucked under the "Cash Flows from Financing Activities" section. Let's say Innovate Inc. paid out $500,000 in dividends to its shareholders.
With these two figures in hand, we have everything we need to apply the formula.
Retention Ratio = (Net Income - Dividends) / Net Income
Now, let's plug in our numbers:
($2,000,000 - $500,000) / $2,000,000 = $1,500,000 / $2,000,000 = 0.75
Multiply by 100 to get a percentage. Innovate Inc. has a retention ratio of 75%. This means it took three-quarters of its profits and plowed them right back into the business to fuel future growth—a key strategic insight for any employee to understand.
Using Spreadsheets for Efficient Training
In any real-world setting, you’ll be doing this in a spreadsheet. It’s faster, less prone to human error, and easy to repeat. Creating a simple calculator in Excel or Google Sheets is a great practical skill to teach your team during a training session.
Here’s a basic setup for an exercise:
- Cell A1: Type "Net Income"
- Cell A2: Type "Dividends Paid"
- Cell A3: Type "Retention Ratio"
- Cell B1: Enter the Net Income (e.g., 2000000)
- Cell B2: Enter the Dividends Paid (e.g., 500000)
- Cell B3: Pop in the formula:
=(B1-B2)/B1
The last step is to format cell B3 as a percentage. Just like that, you have a reusable template that anyone can use to quickly analyze different companies or time periods. This simple tool empowers team members to apply what they've learned immediately and run these important financial checks with confidence.
What the Retention Ratio Reveals About a Company
Figuring out the retention ratio is the easy part. The real magic—and the core of any good financial training—is understanding what that number tells you about a company’s strategy, ambition, and where it's headed next. It’s a single percentage, but it packs a ton of information, making it a crucial concept for any team that needs to understand financial health.
Think of it as a strategic compass. It's either pointing toward aggressive growth or toward stable, predictable returns. Neither direction is inherently right or wrong—it all depends on the company's age, its industry, and its strategic goals.
The Story of a High Retention Ratio
When you see a high retention ratio, say in the 70% to 100% range, you're looking at a company that’s all in on growth. These are often younger, innovative players who see a massive runway ahead. So, instead of paying out profits, they plow that money right back into the business.
Where does that reinvested cash go? This is a great discussion point for a training session:
- Research and Development (R&D): Pouring money into creating the next big thing.
- Market Expansion: Pushing into new cities, countries, or customer demographics.
- Strategic Acquisitions: Buying smaller companies to gain new technology or market share.
- Infrastructure & Training: Building better factories, overhauling software systems, or investing in employee development to scale operations.
For a tech startup or a biotech firm, a high retention ratio isn't just a good idea; it's a survival tactic. It’s a signal from leadership that the smartest thing they can do with their capital is to bet on themselves.
The Tale of a Low Retention Ratio
On the flip side, a low retention ratio (often anything below 50%) tells a completely different story. This is typically the signature of a mature, stable company that has already peaked in terms of explosive growth. Think of utility companies, consumer goods giants, or blue-chip banks.
These businesses have fewer groundbreaking investment opportunities. So, rather than sitting on a pile of earnings, they reward shareholders with dividends. A low retention ratio signals stability, confidence, and a focus on immediate returns. It says, "We've made it, and now we're sharing the wealth."
A company's retention ratio is a direct reflection of its capital allocation strategy. It answers the question: "What is the most valuable thing we can do with our profits right now?"
This is a perfect spot in a corporate training session to get interactive. Imagine a short video scenario where you show two company profiles—one a fast-moving tech startup, the other a long-established utility provider. Then, ask the learner to click on which one they think has the higher retention ratio. Using a tool like Mindstamp, you can build these simple, active learning moments that make the concept stick.
Interpreting Different Retention Ratio Levels
To make it even clearer for your trainees, here’s a quick guide to what different retention ratio levels generally mean.
This table provides a solid framework for interpreting the numbers. A company's strategy can change, and its retention ratio will move right along with it—a dynamic concept that training should emphasize.
Connecting Retention Ratio To Sustainable Growth
When you teach the retention ratio, you’re not just explaining past results—you’re giving your team a tool to forecast tomorrow’s possibilities. This one metric feeds directly into a company’s Sustainable Growth Rate (SGR), which is the maximum pace a business can expand using only its own profits.
Retained earnings act as fuel for growth. Holding onto profit lets a company invest in new products, upgrade equipment, or fund employee development programs. This self-funded growth is often more reliable and cost-efficient than taking on debt or issuing new shares.
Linking Retention To Sustainable Growth
At the heart of this link lies a straightforward equation that's perfect for a training module:
Sustainable Growth Rate = Retention Ratio × Return on Equity (ROE)
Key takeaways for learners:
- Retention Ratio measures the share of earnings a company plows back into the business.
- ROE reveals how profitably those retained earnings are deployed.
Even a 100% retention rate won’t generate growth if reinvestment yields poor returns. In other words, reinvesting profit is just one side of the equation—you also need strong operational performance to put those funds to work effectively.
This visual highlights:
- A high ratio signals an emphasis on reinvestment.
- A low ratio suggests a focus on returning capital to shareholders.
- Context is everything.
A company’s ability to grow organically is directly tied to two core decisions: how much profit to keep and how effectively it puts that profit to work. The retention ratio and ROE measure exactly that.
Applying This Concept In Training
Turn these insights into an engaging training module with hands-on exercises:
- Ask learners to calculate the Retention Ratio and ROE from sample financial statements.
- Challenge them to multiply these figures and uncover the SGR in an interactive quiz.
To truly understand the value of training your team in these concepts, you need to see how it impacts their decision-making. You can learn more about measuring the ROI on training.
By drawing a clear line between profit decisions and long-term growth, you give every employee a direct view of how their work drives the company forward. For real-world inspiration, explore data-driven bank customer retention strategies that turn facts into sustainable profitability.
Making Financial Training Stick
Let's be honest: static presentations and dense spreadsheets are where financial training goes to die. If you really want employees to grasp something like the retention ratio formula—and more importantly, why it matters—you have to get them out of passive listening mode. The goal for any L&D professional should be to turn a dry lesson into a hands-on experience.
This is where interactive video really shines. Instead of just flashing the formula on a slide, you can build a learning environment where employees have to actually participate. It turns a one-way lecture into a two-way conversation, which makes a huge difference in comprehension and recall.
From Passive Viewing to Active Learning
The idea is to make learners do something, not just watch. With an interactive video platform, you can embed elements directly into your training that require engagement. This approach forces employees to stop just absorbing information and start actively applying it as they learn.
Here are a few ideas for your next financial training module:
- In-Video Quizzes: After explaining Net Income and Dividends, pause the video. Show a sample financial statement and ask learners to type in the numbers to calculate the retention ratio right there in the video player.
- Clickable Hotspots: When a term like "retained earnings" pops up, make it a clickable hotspot. Clicking it could reveal a quick definition or a link to an internal resource.
- Branching Scenarios: Present a scenario where a company has a high retention ratio. Ask the learner to choose the most likely reason—are they pouring money into R&D, expanding overseas, or paying down debt? Based on their answer, the video can jump to a different path that explains the real-world outcome of that choice.
This screenshot shows how you can layer different interactive elements onto a video timeline, creating a much more dynamic and effective learning path for your team.
By building in these interactive moments, you create a learning experience that lets people work at their own pace and reinforces key concepts through immediate, hands-on application.
Why Interactivity Cements Knowledge
This kind of active participation is a game-changer for complex topics like finance. When employees can physically interact with the material—clicking, typing, and making decisions—they build much stronger mental connections to the concepts. This active involvement is a cornerstone of great training and is key to improving employee knowledge retention.
By making financial concepts tangible and interactive, you empower employees to not only understand the 'what' but to deeply grasp the 'why' behind metrics like the retention ratio. This creates a more financially literate and strategically aligned workforce.
Platforms like Mindstamp give corporate trainers the tools to build these kinds of experiences without needing a team of developers. You can track engagement, see quiz results, and pinpoint exactly where employees might be getting stuck. This data helps you continuously improve your training for maximum impact.
Limitations Of The Retention Ratio And Key Alternatives
The retention ratio formula offers a quick snapshot of how much profit a company reinvests. But as with any metric taught in corporate training, it's crucial to understand its limitations. Taken alone, it can be misleading.
It highlights what portion of net income stays in the business. Yet it doesn’t explain whether those funds are invested wisely to boost future returns. A one-time asset sale, for example, could inflate net income and make the retention ratio look great, even if underlying performance is weak.
- Does not account for reinvestment quality
- Ignores debt and equity financing effects
- Fails to show dividend policy sustainability
- Can be skewed by non-recurring items
Alternatives And Complements for Deeper Learning
In your training, position the retention ratio as one tool in a financial toolbox. To complete the picture, employees need complementary metrics that address its blind spots.
- Return on Equity (ROE) measures profit generated per dollar of shareholder equity.
- Dividend Payout Ratio reveals the share of earnings paid out as dividends.
- Sustainable Growth Rate links the retention rate to realistic growth expectations via ROE.
When learners combine these metrics, their understanding of capital allocation gains real depth. Suddenly, they’re not just looking at cash plowed back—they’re evaluating its actual impact.
Key Insight A high retention ratio only matters when retained capital generates real, lasting returns. This is a critical takeaway for any training session.
Comparing Retention And Payout Ratios
This side-by-side view helps clarify that retention and payout ratios are two sides of the same coin, simplifying the concept for learners.
Incorporating Findings Into Training
Numbers come alive when your team applies them to real scenarios. Here are a few ways to build hands-on financial skills in your training programs:
- Pose quiz questions that require calculating the retention ratio from sample data.
- Use branching video paths to illustrate different reinvestment outcomes.
- Embed hotspots defining Net Income and Dividends as learners engage with content.
Such interactive modules, powered by a platform like Mindstamp, turn abstract theory into practical expertise. They boost comprehension and ensure your team retains key financial concepts. Learn more about practical evaluation in our guide on training evaluation methods.
By pairing the retention ratio with ROE and payout metrics, your team will develop the critical-thinking skills essential for sound financial leadership.
Common Questions About the Retention Ratio
When you start digging into the retention ratio formula during training, a few questions always pop up. Addressing them directly helps your team go from just knowing the formula to actually understanding how to apply it strategically.
One of the first questions is, "What's a 'good' retention ratio?" This is a perfect teachable moment.
The answer is: it depends entirely on the company's strategy and industry. A young tech startup might aim for 100% retention, plowing every cent back into the business to fuel growth. In contrast, a mature utility company might have a ratio closer to 20%, focusing on rewarding shareholders with steady dividends.
Clarifying Key Distinctions
Another common point of confusion is the relationship between the retention ratio and the dividend payout ratio. You can simplify this for learners by explaining they're two sides of the same coin.
The retention ratio is the percentage of earnings a company keeps. The payout ratio is the percentage it gives away. Together, they always add up to 100%.
Finally, trainees often wonder if a negative retention ratio is possible. Yes, it is. This happens when a company pays out more in dividends than it earned in a period. While it can be a temporary move, a recurring negative ratio could be a red flag—an important analytical point to cover in training.
A great way to handle these questions proactively is with interactive video. Imagine a short Q&A module where your team can click on a specific question, and a quick video explanation pops up. It’s on-demand learning that reinforces concepts right when they need it.
Answering these questions clearly is what turns abstract financial metrics into practical tools. It helps your team move beyond simple calculations and start thinking strategically, which is the real goal of any effective financial training program.
Ready to transform your financial training from passive lectures into active learning experiences? With Mindstamp, you can embed quizzes, hotspots, and even branching scenarios directly into your videos. This ensures concepts like the retention ratio formula actually stick. Find out how you can build more engaging and effective training content at https://mindstamp.com.
Get Started Now
Mindstamp is easy to use, incredibly capable, and supported by an amazing team. Join us!


Try Mindstamp Free


