

How to Measure Content Performance in Corporate Training


For too long, corporate training has been stuck on one number: the completion rate. But let's be honest—just because someone sat through a video doesn't mean they learned a thing. It tells you nothing about whether they were engaged, if the key concepts landed, or if they can actually apply what they saw on the job.
If you're in learning and development (L&D), you know the real challenge is proving your training actually moves the needle on business results. It’s time to stop asking, "Did they finish?" and start asking, "Can they perform?"
Moving Beyond Completion Rates

This guide is all about ditching those outdated metrics and adopting a modern framework for measuring what truly matters in a corporate setting: learner engagement, knowledge retention, and skill application.
We'll dig into how you can use performance-based data, especially from interactive video platforms like Mindstamp, to get real insights into your training content. By focusing on how learners interact with training materials, you can finally connect your L&D programs to tangible, measurable business outcomes.
Why Completion Rates Just Don't Cut It
Relying on completion rates alone gives you a false sense of security. An employee could easily hit play, mute the training video, and go back to their emails, yet still be counted as "complete."
This metric fails to answer the questions that really define effective training. Did the technician actually understand that complex safety procedure? Can the sales team now articulate the new product features confidently? Or did they just click "next" until the module was over?
Shifting your measurement strategy is about connecting learning activities directly to performance outcomes. The goal is to prove that training isn't a cost center, but a strategic driver of organizational growth and efficiency.
A Smarter Way to Measure Training ROI
This new approach means looking at a different set of data points—ones that show you exactly how learners are interacting with the training material. This is where tools with deeper analytics, like interactive video, become non-negotiable. They let you see precisely where employees are getting stuck, which concepts are resonating, and how well they can apply their newfound knowledge.
Instead of just tracking views, you'll focus on:
- Active Engagement: Are learners clicking on resources, answering questions, or rewatching key segments of a training video? These are the footprints of active learning.
- Knowledge Comprehension: In-video quizzes and polls give you a real-time pulse check on whether your team is actually absorbing the information.
- Behavioral Application: The ultimate test. This involves connecting training data with on-the-job performance metrics, like a drop in support tickets or faster task completion times after training.
To get started, it helps to have a clear picture of what these modern training KPIs look like. Old-school metrics like "time spent" are being replaced by more meaningful indicators of success in a corporate L&D context.
Here's a quick overview of modern KPIs that offer a much clearer picture of training effectiveness than traditional metrics ever could.
Essential Metrics for Training Content Performance
Focusing on metrics like these transforms training from a checkbox activity into a powerful performance improvement tool. You're no longer just delivering content; you're gathering actionable data to refine your L&D programs and prove their value to the entire organization.
Building Your Measurement Framework
A solid plan for measuring your training content has to start with clear, business-focused goals. Before you can even think about performance, you need to define what success actually looks like for the business. This is about connecting your training objectives directly to the company's bottom line.
It’s the difference between saying "the training is complete" and "the training created this specific, valuable outcome."
For example, a win might be a 15% reduction in costly production errors after you roll out a new procedural training video. Or maybe it's a measurable jump in customer satisfaction scores that you can directly link to a new customer service skills module. The key is to always start with the end result in mind.
Defining Your Core Training Objectives
Your goals have to be specific and quantifiable. "Improve sales skills" is way too vague. A much better goal is to "increase the average deal size by 10% for reps who complete the advanced negotiation module." See the difference? That ties the training directly to a hard revenue metric.
To get this right, think about the different kinds of training you create:
- Technical Skills: Link these to efficiency. A new software training video could be measured by a drop in help desk tickets about that specific software.
- Leadership Development: This is a bit trickier, but you can connect it to things like employee retention or internal promotion rates.
- Compliance Training: This one's often straightforward. Success here might look like a reduction in safety incidents or hitting a 100% audit pass rate.
A structured measurement framework transforms training data from a simple report card into a powerful story about business impact. It shifts the conversation from training as a cost to training as a value-driver, proving L&D is critical to the organization's success.
This whole process—from setting goals to picking KPIs and setting targets—is the bedrock for accurately measuring how your training content is performing.
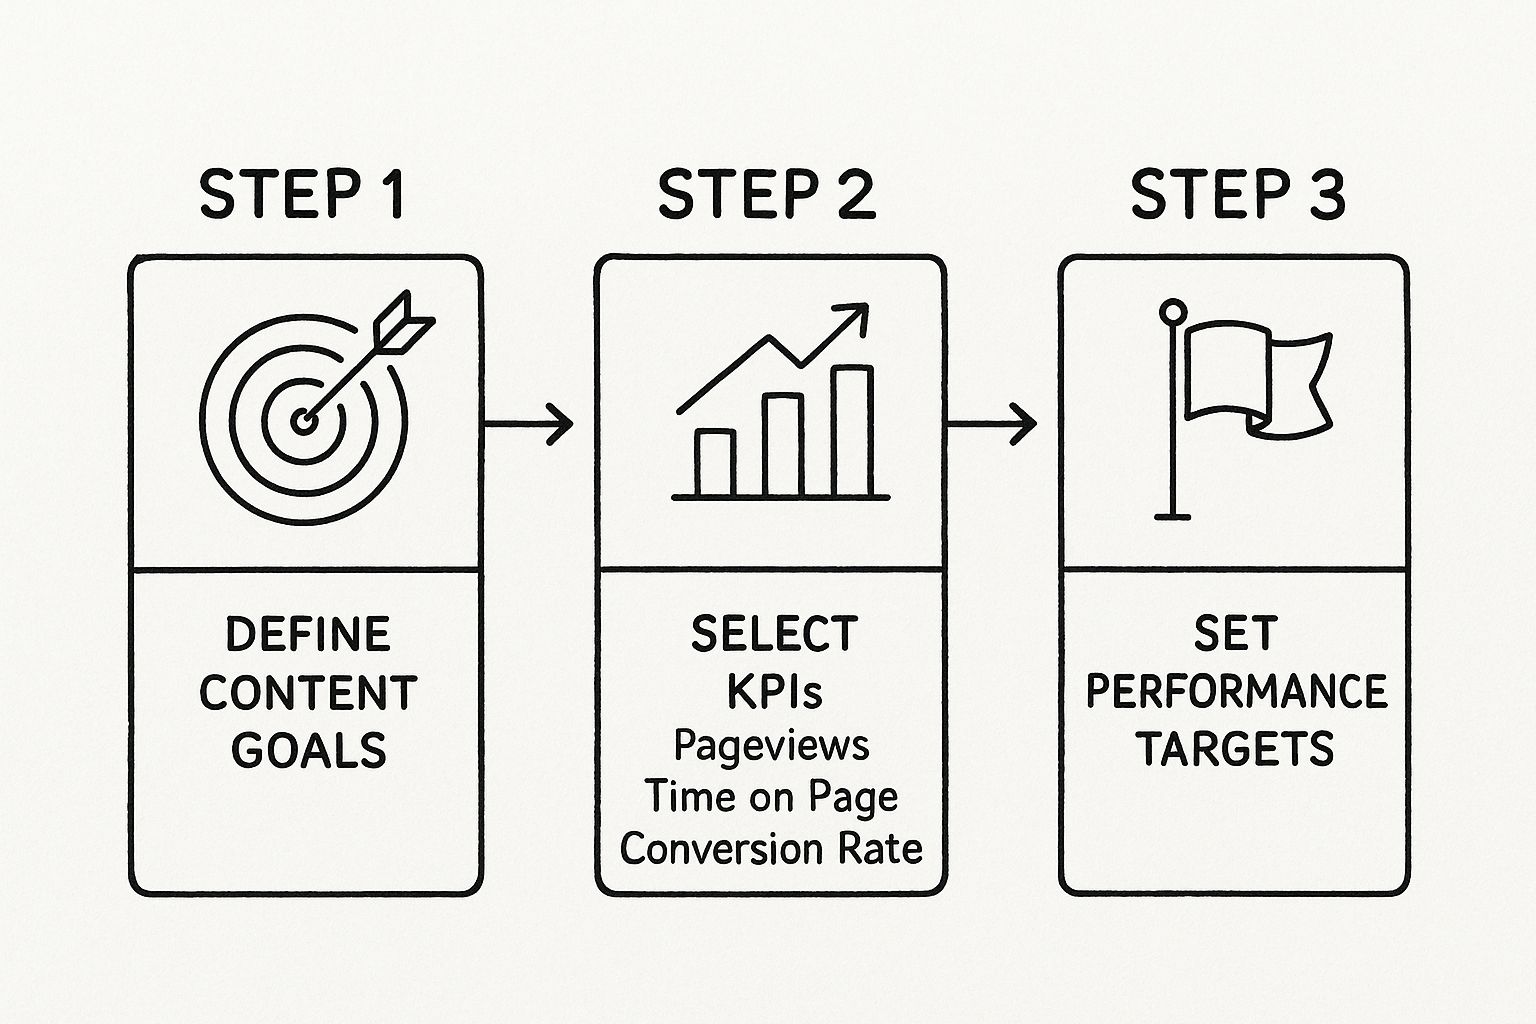
This visual really hammers home the importance of a systematic approach. It ensures every single metric you track is directly tied to a business goal you set from the very beginning.
Mapping KPIs to Your Content
Once your objectives are locked in, it’s time to pick the right Key Performance Indicators (KPIs). Good training content measurement isn't a one-size-fits-all game; you need a plan that tailors KPIs to the type of training you're evaluating. A marketing team tracking page views is playing a totally different sport than an L&D team measuring skill acquisition.
This is where interactive video really changes things. Your KPI options become so much more insightful. Instead of just looking at completion rates, you can track tiny, granular interactions that signal genuine understanding and engagement from your employees.
For instance, this dashboard view shows how you can track specific learner engagement and collect feedback in real-time.
Having this level of detail lets you see exactly where learners are getting it and where they’re struggling. You can then connect these specific interaction metrics back to your broader business goals, building a complete picture of your training's real-world effectiveness. For a deeper dive, check out our complete guide on how to measure training effectiveness.
Choosing Metrics That Actually Matter

It’s so easy to get lost in a sea of data. When you're trying to figure out how to measure content performance for training, the biggest mistake you can make is tracking everything instead of the right things.
For corporate training, this means pushing past the vanity metrics and zeroing in on actionable indicators that show you if learning is actually happening. These are the numbers that tell a real story about engagement, comprehension, and whether skills are being applied on the job. Without them, you’re just guessing.
Beyond Views and Clicks
Sure, engagement is fundamental, but not all engagement metrics are created equal. Simple video views are relics—they show you how many people showed up, but not what they did when they got there. We've moved on to metrics like question accuracy and interaction rates, which give you a much clearer picture of what your learners are actually doing.
For training videos, this means digging way deeper into the viewing experience. This is where interactive video platforms really shine, offering a treasure trove of granular data that directly reflects learning.
Here are a few metrics that L&D professionals should prioritize:
- Question Response Accuracy: This is a direct line to comprehension. If 70% of employees get a key question wrong, you’ve just found a massive knowledge gap you need to fix.
- Viewer Drop-Off Points: Seeing a huge drop-off right in the middle of a complex technical explanation is a blaring signal. That part of the content is either confusing or boring, and it needs a rewrite.
- Click-Through Rates on Resources: Tracking clicks on in-video links, buttons, or downloadable guides tells you exactly which supplementary materials your learners find valuable.
Connecting Granular Data to Business Goals
These specific data points are so powerful because they draw a straight line from a single learner’s click to a high-level business goal. Think of it as connecting the dots between a micro-interaction and real organizational success. While marketing teams often use digital marketing performance metrics for growth, L&D professionals must focus on metrics that tie directly to employee capabilities and business operations.
Imagine you rolled out a new safety compliance video. You notice that a ton of employees are re-watching the section on operating a specific machine. That insight is gold. It tells you the procedure is tricky and might need a follow-up job aid or even a hands-on session.
By analyzing these micro-interactions, you move from passively delivering training to actively diagnosing performance issues before they impact the business. You can proactively address confusion, reinforce critical concepts, and refine training content for maximum clarity.
The Power of Interactive Video Analytics
This is exactly where platforms like Mindstamp completely change the game for corporate training. Instead of a black box where you only see who started and finished, you get a detailed map of each learner's journey. You can see not just if they answered a question, but how they answered it. This level of detail is crucial when you want to measure employee engagement in a way that actually reflects learning.
This data lets you segment your audience and spot patterns. Do new hires struggle with different concepts than tenured employees? Does the sales team in one region consistently bomb the product knowledge quizzes? Answering these questions allows you to tailor your training, optimize your content, and ultimately prove the value of your L&D initiatives with hard evidence.
So You Have the Data. Now What?
Collecting data is just the starting line. The real magic happens when you turn those raw numbers into a clear plan for making your training content better. Simply knowing your metrics isn't the goal—you have to understand the story they're telling you about your learners and your training.
This is the part where you graduate from being a content creator to a data-informed training strategist. It’s all about looking at the numbers and asking, "Okay, what does this actually mean for our team's performance?"
Let's say you're looking at the analytics for a new product training module. You spot that a huge chunk of your sales team is getting the same quiz question wrong. That's not just a failed quiz attempt. It’s a glaring knowledge gap that could be killing deals. This is your cue to jump in immediately, maybe with a quick microlearning video or a simple job aid to clear up that specific concept.
Finding the Real Story in Your Numbers
The secret to finding these game-changing insights is to hunt for patterns and outliers. A single data point can be a fluke, but a consistent trend is something you can act on. Don't just glance at the overall averages; slice and dice your data to get the full picture.
By filtering your analytics, you can compare how different groups are doing and uncover their unique needs. Try breaking down your data by:
- Department: Is the engineering team flying through compliance training while the marketing team is getting stuck?
- Role: Are junior employees struggling with concepts that senior staff breeze through?
- Region: Are some offices showing lower comprehension rates? Maybe they need more localized support.
This level of detail lets you move past generic, one-size-fits-all training and start creating personalized learning paths. You can pinpoint exactly where to focus your energy, making your L&D efforts way more efficient and effective. While the broader content marketing world looks at the top content marketing KPIs for 2025 on wearecsg.com, the focus for L&D remains squarely on learner improvement and business impact.
Creating a Powerful Feedback Loop
Analyzing your training data shouldn't be a one-and-done thing you do at the end of the quarter. The best L&D teams build a continuous feedback loop where performance data is constantly used to refine training content.
This iterative cycle is what separates good training programs from great ones. You're not just launching content and crossing your fingers; you're actively using learner behavior to make it better, day after day.
Think of your analytics dashboard as a live conversation with your employees. High drop-off rates are your learners screaming, "This part is boring or doesn't make sense!" High clicks on a specific resource are them saying, "Yes, more of this, please!"
When you listen to this feedback and act on it, you create a living, breathing learning ecosystem. It ensures your training stays relevant, engaging, and locked in on what your organization really needs. That's how you build better content and, ultimately, drive results you can actually measure.
Optimizing Content and Proving Training ROI

Okay, now it's time to close the loop. You’ve gathered the data and uncovered key insights—the final step is actually using them. This is where you optimize your training materials and, just as importantly, show their value to the rest of the company.
Think of the performance data you've collected as direct feedback from your learners. It's an evidence-based way to stop guessing what works and start knowing.
For instance, if your analytics show a huge drop-off rate on a passive compliance video, that’s a flashing red light. It's a clear signal to inject some interactivity. You could use a platform like Mindstamp to add branching scenarios that force learners to make decisions or drop in a quick knowledge-check question to snap them back to attention.
Concrete Strategies for Content Improvement
Your data is a roadmap pointing directly to what you need to fix, refine, or even double down on. This moves you beyond guesswork and into a cycle of continuous improvement for your L&D programs.
Here are a few actionable ideas based on common data points I see all the time:
- Frequently Re-watched Segments: If you notice learners are constantly rewinding a specific part of a process video, it’s probably too complex or unclear. Your move? Create a downloadable checklist or a simple one-page job aid summarizing that exact process and link it right in the video at that spot.
- Low Quiz Scores on a Topic: Consistently poor performance on questions about a new product feature is a major red flag for comprehension. A great fix is to create a short, focused microlearning video that only covers that feature and assign it as follow-up content.
- High Engagement with Optional Resources: When learners are eagerly clicking on supplementary materials, that's a gift! It tells you they have an appetite for more. Use that insight to build out a more robust resource library or create an advanced training module on that topic.
The goal is to let learner behavior guide your content creation. Every data point is a piece of feedback telling you how to make your training more effective, engaging, and impactful for the people who actually use it.
Calculating and Presenting Training ROI
This is the big one. This is how you prove that your L&D initiatives are a strategic investment, not just another cost center. To pull this off, you have to connect your improved engagement and comprehension metrics to real, tangible business outcomes.
Start by identifying the specific business metric your training was designed to influence in the first place. For a safety training program, that should be fewer workplace incidents. For an onboarding program, it's a faster time-to-productivity for new hires.
You can dig deeper by exploring different ways of measuring the ROI on training. This is critical for building a compelling case for your L&D budget and getting buy-in from leadership.
Let's walk through an example. Say you optimized a sales training video with interactive questions, which led to a 30% increase in quiz score accuracy. Great! But you can't stop there. Now, you correlate that with sales performance data. If you see that the reps who mastered the content also increased their average deal size by 10%, you’ve just demonstrated a clear and powerful return on investment.
Here’s a simple way to structure a performance report to share with leadership:
Presenting your data this way completely shifts the conversation. You’re no longer talking about training activities; you're talking about business results. That's how you solidify the strategic importance of your learning and development efforts.
A Few Common Questions We Hear
Diving into data-driven training usually sparks a few questions. Let's tackle some of the most common challenges L&D pros run into when they start digging deeper into content performance.
I Only Track Completion Rates. Where Do I Even Start?
The secret is to start small and get a quick win. Don't try to boil the ocean and reinvent your entire measurement strategy at once.
Pick a single, important training program—maybe your new hire onboarding or a critical safety procedure—and tie it directly to a business outcome. That could be something like shortening the time it takes a new employee to become productive, or seeing a drop in reported safety incidents.
From there, just add one or two new engagement metrics to that one program. If you're using an interactive video tool like Mindstamp, you could start tracking quiz scores within the onboarding videos. Or maybe you see which downloadable safety checklists are getting the most clicks. Running a focused pilot project like this lets you build a powerful case study for a bigger strategy without overwhelming your team.
The goal here is to prove the concept on a small scale. A single, clear win is far more convincing than a dozen confusing charts. It shows the real value of deeper analytics and builds the momentum you need to roll it out everywhere.
How Do I Measure Something "Soft" Like Communication Skills?
This is a great question. Measuring the impact of soft skills training—like leadership or communication—is a bit different. You're tracking a change in behavior, not just whether someone remembered a fact.
This is where a multi-faceted approach comes in. You can’t just rely on a single in-video metric.
Start by building interactive videos with branching scenarios that mimic real workplace conversations. This lets you see an employee's decision-making process when they're put on the spot.
Then, you need to combine that data with other sources:
- Pre- and post-training self-assessments to see how their confidence and perceived skills have changed.
- Structured feedback from managers that focuses on specific, observable behaviors.
- 360-degree reviews to get a sense of how their peers see their collaboration and team dynamics.
When you look at all these data points together over time, you get a much richer, more accurate picture of whether the training actually worked.
How Often Should I Be Looking at My Training Performance Data?
There's no single right answer here—it really depends on the content.
For your foundational, evergreen stuff like new hire orientation or annual compliance training, a quarterly review is probably perfect. That cadence is frequent enough to spot long-term trends and make smart adjustments, but not so frequent that you're drowning in data.
But for more time-sensitive training—think a new product launch or a major software update—you've got to be more nimble. For that kind of content, plan on checking the performance data weekly for the first month. This lets you quickly spot where people are getting confused, address knowledge gaps, and push out improvements while the information is still mission-critical.
Ready to see what’s happening inside your videos and move beyond simple completion rates? Mindstamp makes it incredibly simple to add questions, branching scenarios, and deep analytics to any video. Start your free trial today and see how interactive video can transform your L&D strategy.
Get Started Now
Mindstamp is easy to use, incredibly capable, and supported by an amazing team. Join us!


Try Mindstamp Free


