Announcing the new Mindstamp Insights Dashboard
Mindstamp recently released a new set of visualization and insights tools designed to help you better track, understand and optimize your interactive videos. Take a look at the new Insights tab on your dashboard (looks like this) and have a look around. You’ll see 4 new graphs and 2 new tables, including...

Engagement
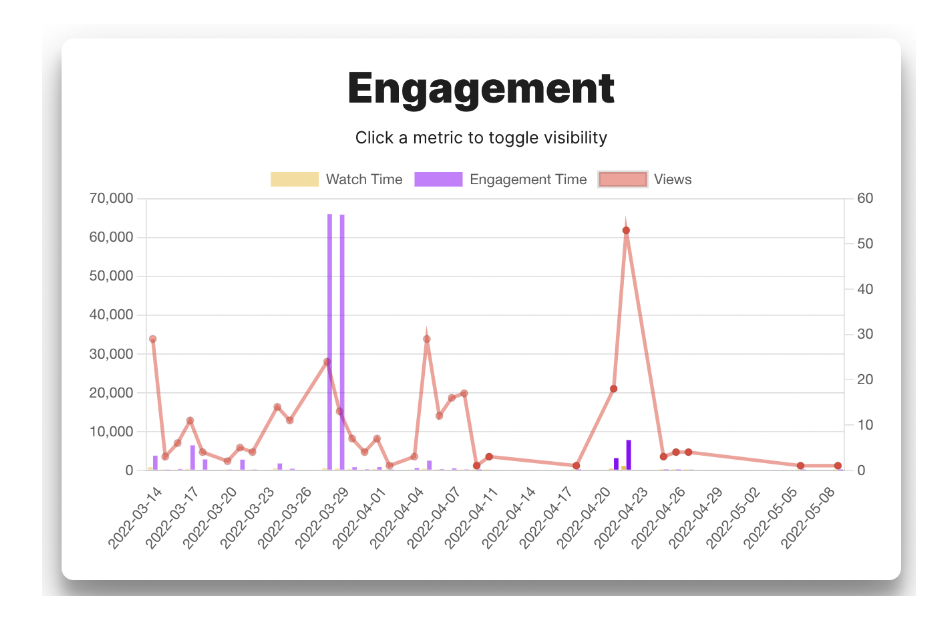
Toggle data around viewer watch time, engagement time, and total views to see how well your interactive video content is performing and how engaged your audience is. You can click on any of the data points to toggle the feature on and off and compare how data has changed over time. Watch time is total minutes that your video was playing whereas engagement time includes periods where you viewer is engaged with additional interactive content, such as answering a question, filling out a form, reading a linked webpage or checking out with a shopping cart.
Completion
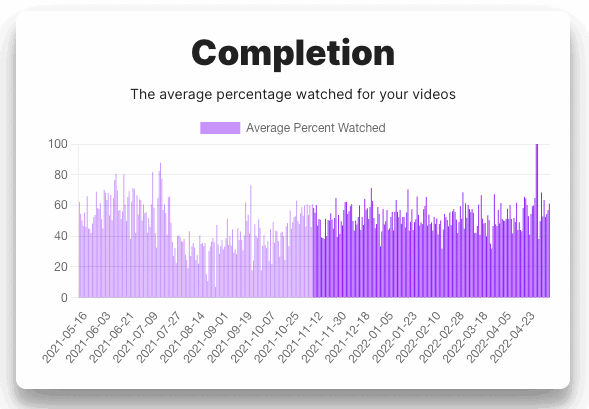
See how the percentage watched for your videos is trending over time to track how different audiences or marketing campaigns relate to video efficacy and impact.
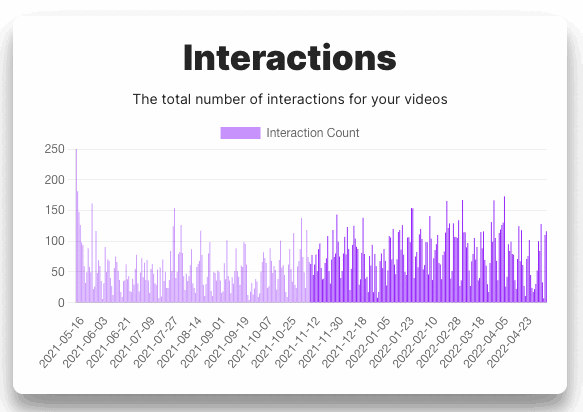
Interactions
Quickly tally total interactions on your videos by day. You can also see top interactions to see which interactions have the most impact on your audience.
Geography
Visualize where in the world your interactive video viewers are coming from and drill into the United States to see state by state performance.
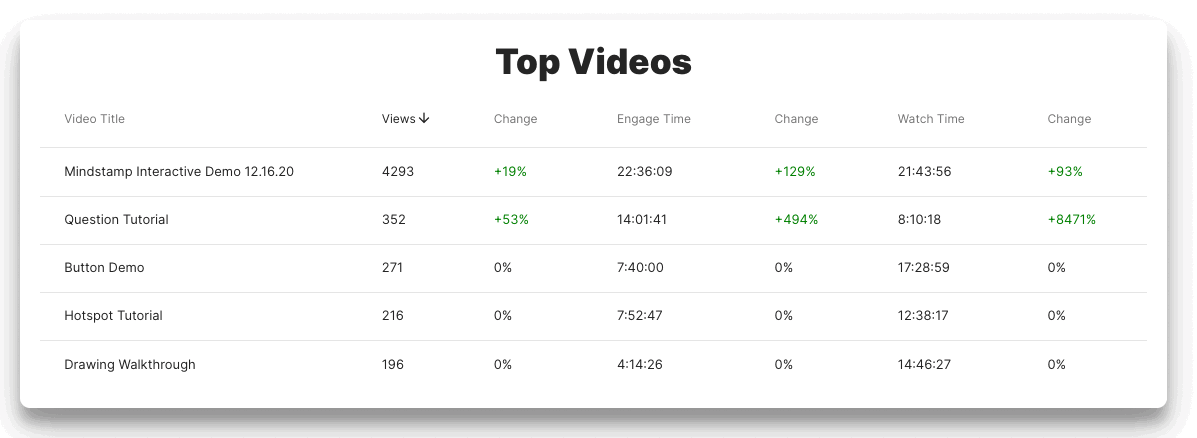
Top Videos
See your top videos and how they have performed against other interactive videos in your library, including views, engagement time and watch time.
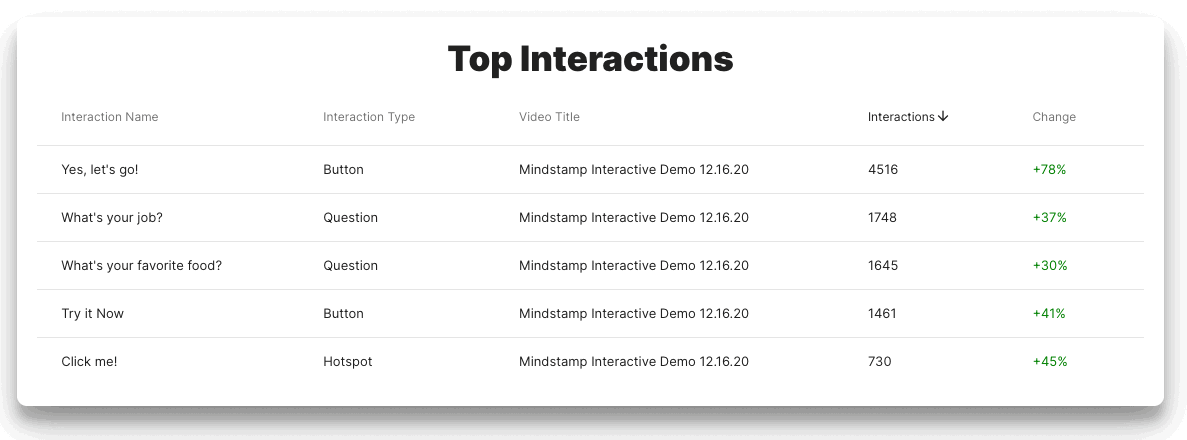
Top Interactions
See which interactions by type, from buttons and hotspots to questions and images, get the most engagement from your viewers.
Of course with our Insights Data Filters you can easily filter your Insights by Video, by period of time, by Series or by Group to get a snapshot of the information that matters most.
Get Started Now
Mindstamp is easy to use, incredibly capable, and supported by an amazing team. Join us!


Try Mindstamp Free


