The challenge: record a decision made by eye
Professor Ronan Cahill’s team at the UCD Centre for Precision Surgery wanted to measure how surgeons interpret blood supply during an operation. A key decision is where to divide the bowel so that the tissue left behind has enough blood supply to heal.
Indocyanine green fluorescence angiography (ICGFA) uses a dye and a near-infrared camera to show blood flow. Each surgeon must still interpret the image and choose where to cut. The team needed a way for surgeons with different experience to assess the same cases and record that choice.
A written answer alone could not show the exact location. The researchers needed participants to mark a line on the surgical image, then compare those lines across the group.
The solution: draw the answer on the video
The team used Mindstamp to present recorded operations online. Participants opened a study link, answered questions about their experience, and watched a tutorial on the drawing tool. They could complete the study at a time that suited them.
Each case began with a short patient and procedure description. Participants watched the dye reach the tissue. At a fixed frame, the video paused and asked them to draw where they would place the surgical stapler. They saved the line and continued to the next case.
The images below show laparoscopic surgery in the 2020 Mindstamp player.
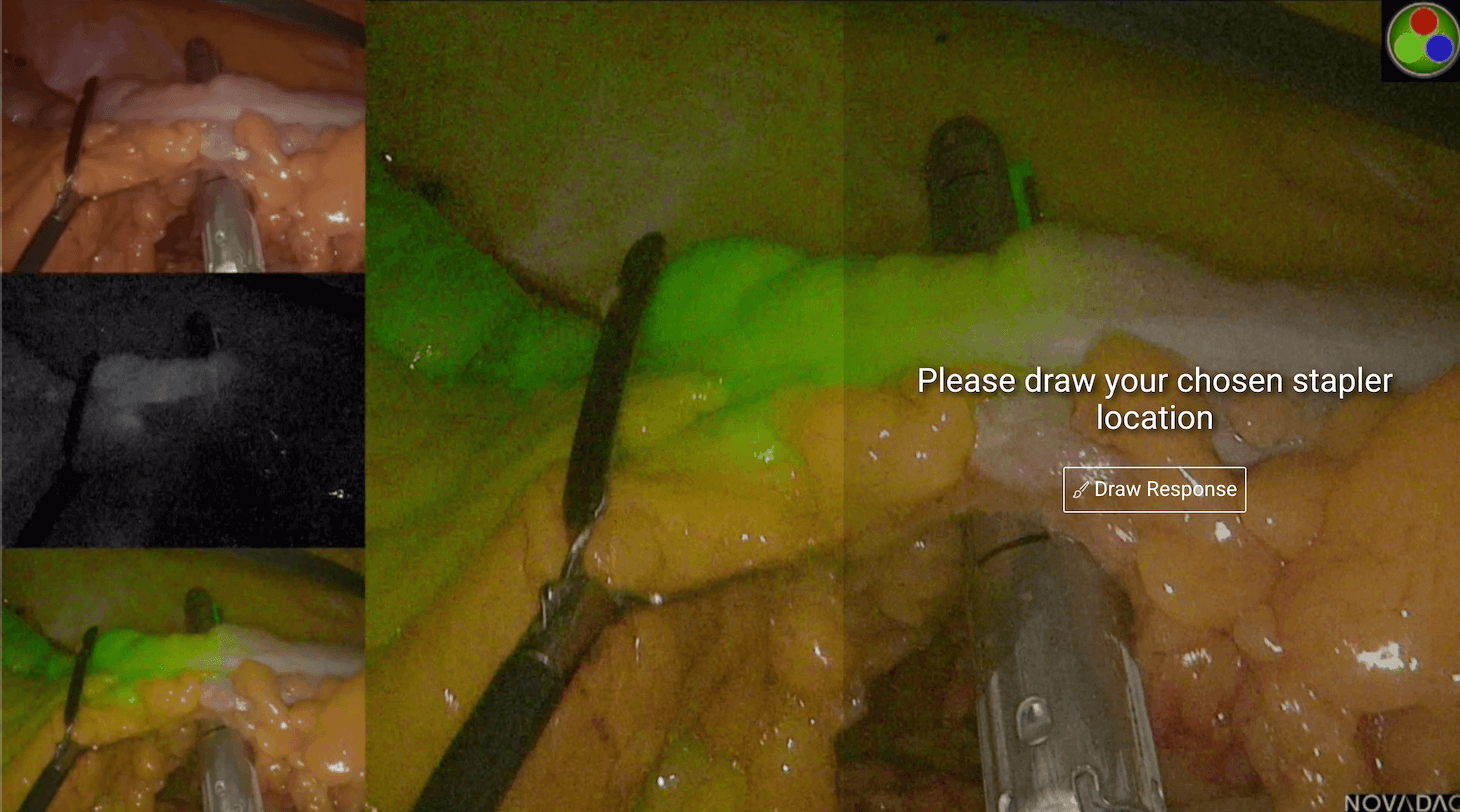
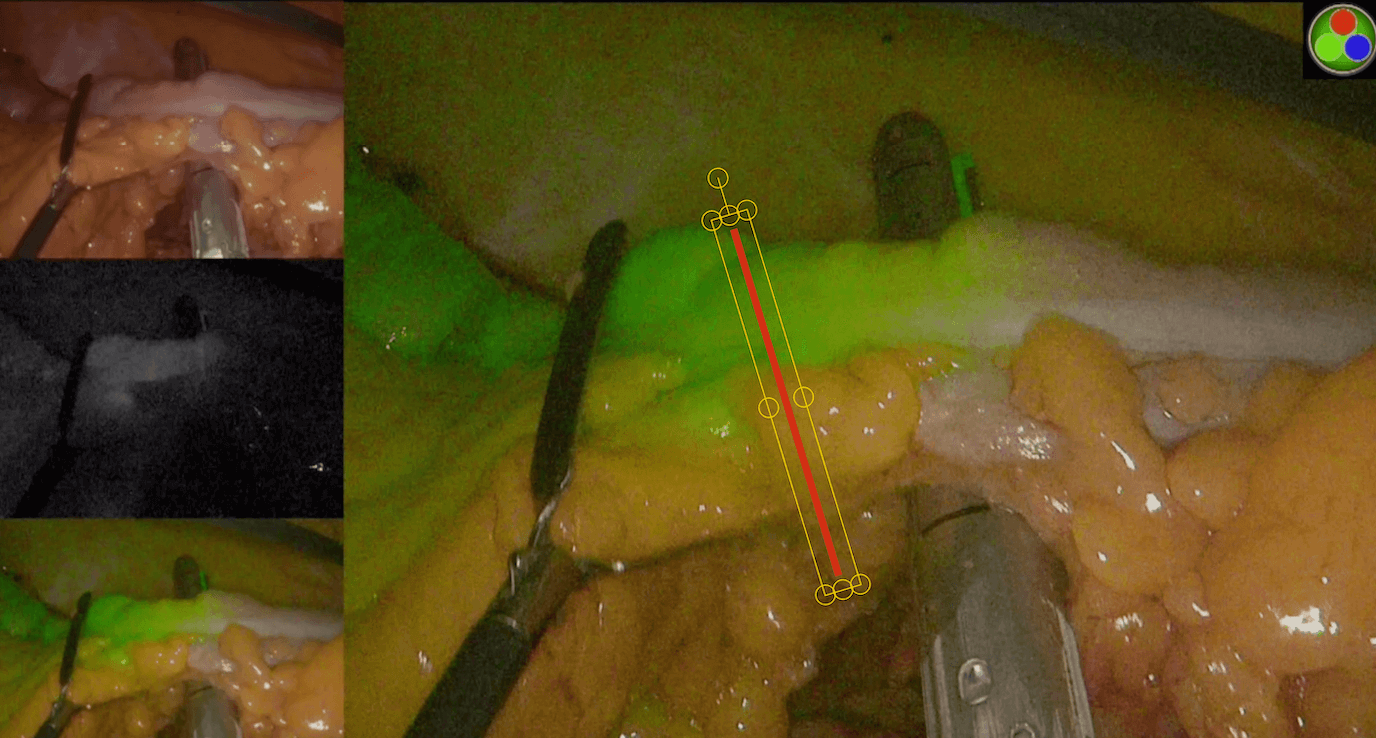
The researchers measured the positions of the saved lines with ImageJ and calculated agreement between participants. This let them compare experts with less experienced surgeons on the same visual decision.
The results: four published studies
The group used Mindstamp to collect judgments in four peer-reviewed studies. Each study tested a different set of cases. Participant counts below apply to each study and do not represent a total of unique clinicians.
Colorectal surgery: 40 participants, 14 videos
In the 2021 study, experts agreed well on where to divide the bowel, while non-experts showed moderate agreement. Neither group agreed on the separate yes-or-no question about whether blood supply was sufficient. The drawing responses revealed agreement that the binary question did not.
Read Hardy et al., Surgical Endoscopy (2021)
Esophageal surgery: 30 participants, eight videos
The 2022 study found moderate agreement among both experts and non-experts. Experts chose lines that preserved more gastric conduit length in seven of the eight videos.
Read Hardy et al., Diseases of the Esophagus (2022)
Recording methods: 58 clinicians, nine videos
In the 2024 colorectal study, agreement was good overall. Agreement was poor for standardized videos shown in overlay mode. The study showed that recording and display methods can change how surgeons interpret the same type of signal.
Read Dalli et al., Surgical Endoscopy (2024)
Rectal polyps: 32 surgeons, 14 videos
A separate 2024 study used Mindstamp questions to record whether surgeons judged an ambiguous polyp benign or malignant, their confidence, and their reasoning. Average visual accuracy was 49%. Higher confidence did not correspond to higher accuracy.
Read Hardy et al., Langenbeck’s Archives of Surgery (2024)
What the results mean
These studies measured decisions on recorded cases. They did not test whether Mindstamp training improved later decisions in the operating room or patient outcomes. The findings identify differences that educators and researchers can examine when they design training.